empty
26.06.2025 05:11 AM
EUR/USD Forecast for June 26, 2025

EUR/USD

Yesterday's data on new home sales in the U.S. for May turned out worse than expected — 623,000 units were sold versus a forecast of 694,000, and the April figure was revised downward from 743,000 to 722,000. As a result, sales dropped by 13.7%. The euro rose by 49 points, while the S&P 500 closed the day unchanged.

Today is an important day for U.S. data. Q1 GDP may show a decline of -0.2%. The Personal Consumption Expenditures (PCE) Price Index for the same period is expected to rise from 2.4% to 3.6%, and durable goods orders for May are expected to increase by 8.6%. However, after April's drop of -6.3%, the new figure is not particularly impressive.

Technically, the U.S. dollar should come under pressure, but the stock market may experience equal pressure. The key issue lies in how synchronized the risk-off moves will be across the currency and equity markets.

This image is no longer relevant

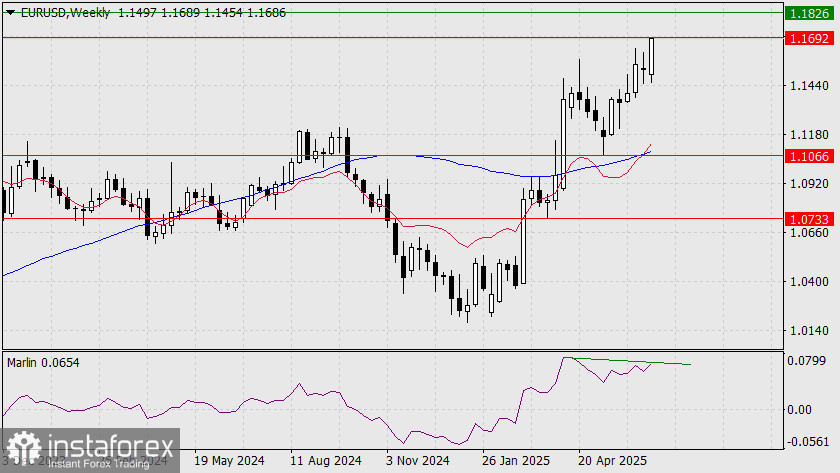
Looking again at the weekly euro chart, the divergence remains in place. It is hard to say whether it will still be valid if the price rises to the next target of 1.1826, but if it does happen, that would mark an ideal time for the euro to reverse into a medium-term downtrend.

This image is no longer relevant

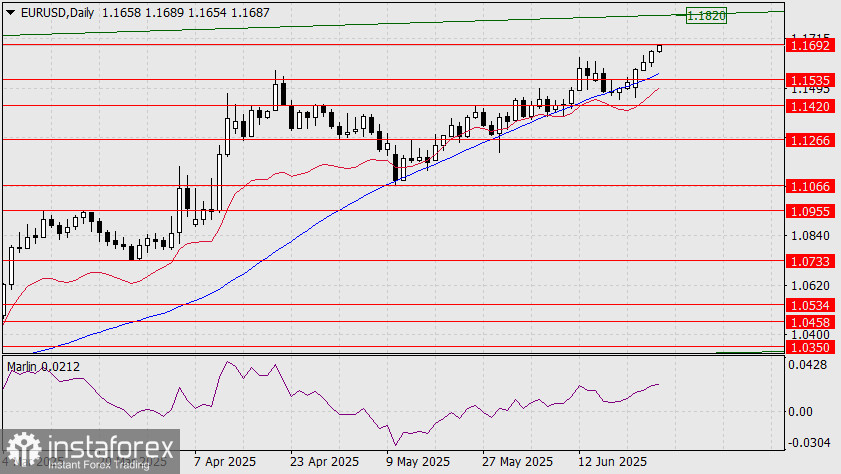
On the daily chart, the target of 1.1820 corresponds to the upper boundary of the price channel. However, it's important to note that when trends reverse, the euro often fails to reach the edges of price channels.

This image is no longer relevant

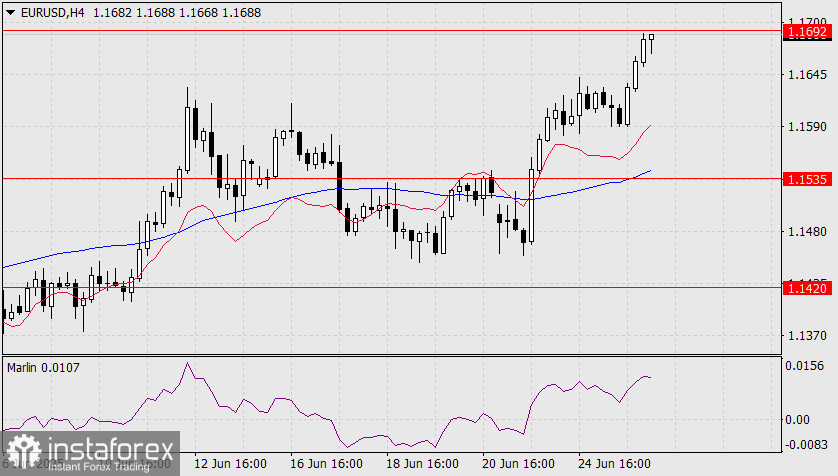
The 4-hour chart does not add further clarity. The uptrend may continue if the price consolidates above the 1.1692 level amid favorable data.

Laurie Bailey,
Analytical expert of InstaTrade
© 2007-2025

Recommended Stories

EUR/USD Forecast for July 25, 2025

At the very last moment, the euro released the tension and abandoned its attempt to retest the upper boundary of the price channel. The day closed below the daily MACD

Laurie Bailey 05:06 2025-07-25 UTC+2

GBP/USD Forecast for July 25, 2025

The British pound failed to overcome the pressure of the daily balance line. Yesterday, the price fell by 69 pips, and this decline continued into the morning. The signal line

Laurie Bailey 05:06 2025-07-25 UTC+2

USD/JPY Forecast for July 25, 2025

The USD/JPY pair is showing a strong upward trend. After rebounding from the support level at 146.29, the price is now heading toward the nearest target at 149.38. This movement

Laurie Bailey 05:06 2025-07-25 UTC+2

Forex forecast 24/07/2025: EUR/USD, GBP/USD, Gold, Ethereum and Bitcoin

Useful links: My other articles are available in this section InstaForex course for beginners Popular Analytics Open trading account Important: The begginers in forex trading need to be very careful

Sebastian Seliga 12:02 2025-07-24 UTC+2

Forecast for EUR/USD on July 24, 2025

On Wednesday, the EUR/USD pair rebounded from the 127.2% Fibonacci retracement level at 1.1712, reversed in favor of the euro, and continued to rise toward the 1.1802 level. A rebound

Samir Klishi 11:21 2025-07-24 UTC+2

Forecast for GBP/USD on July 24, 2025

On the hourly chart, the GBP/USD pair consolidated above the 61.8% Fibonacci retracement level at 1.3530 on Wednesday and rose to the 50.0% level at 1.3579. Today, a rebound from

Samir Klishi 11:05 2025-07-24 UTC+2

Trading Signals for BITCOIN for July 24-27, 2025: buy above $117,000 (6/8 Murray - 21 SMA)

The eagle indicator has been showing a positive signal since July 21. It is likely that any pullback in Bitcoin in the coming days will be seen as a signal

Dimitrios Zappas 06:25 2025-07-24 UTC+2

Trading Signals for GOLD (XAU/USD) for July 24-27, 2025: sell below $3,400 (21 SMA - 7/8 Murray)

The Eagle indicator is signaling a negative sequence, so we believe that any technical rebound, as long as the price trades below the 8/8 Murray level, will be seen

Dimitrios Zappas 06:23 2025-07-24 UTC+2

Trading Signals for EUR/USD for July 24-27, 2025: buy above 1.1745 (21 SMA - 8/8 Murray)

Technically, the euro is reaching exhaustion levels. In the latest trading, Japanese candlesticks called dojis can be seen on the technical chart, indicating market indecision. A technical correction is likely

Dimitrios Zappas 06:18 2025-07-24 UTC+2

If the support level 6327.24 on S&P 500 Index's can withstand today's downward correction, it will lead to renewed strengthening.Thursday, July 24, 2025.

S&P 500 Index – Thursday, July 24, 2025. With the Golden Cross EMA(50) above the EMA(200), buyers are quite dominant. Although the RSI(14) indicator is at a neutral bullish level

Arief Makmur 05:54 2025-07-24 UTC+2
Can't speak right now?
Ask your question in the chat.
 

Dear visitor,

Your IP address shows that you are currently located in the USA. If you are a resident of the United States, you are prohibited from using the services of InstaFintech Group including online trading, online transfers, deposit/withdrawal of funds, etc.

If you think you are seeing this message by mistake and your location is not the US, kindly proceed to the website. Otherwise, you must leave the website in order to comply with government restrictions.

Why does your IP address show your location as the USA?

  • - you are using a VPN provided by a hosting company based in the United States;
  • - your IP does not have proper WHOIS records;
  • - an error occurred in the WHOIS geolocation database.

Please confirm whether you are a US resident or not by clicking the relevant button below. If you choose the wrong option, being a US resident, you will not be able to open an account with InstaTrade anyway.

We are sorry for any inconvenience caused by this message.