See also

 27.10.2023 02:27 PM
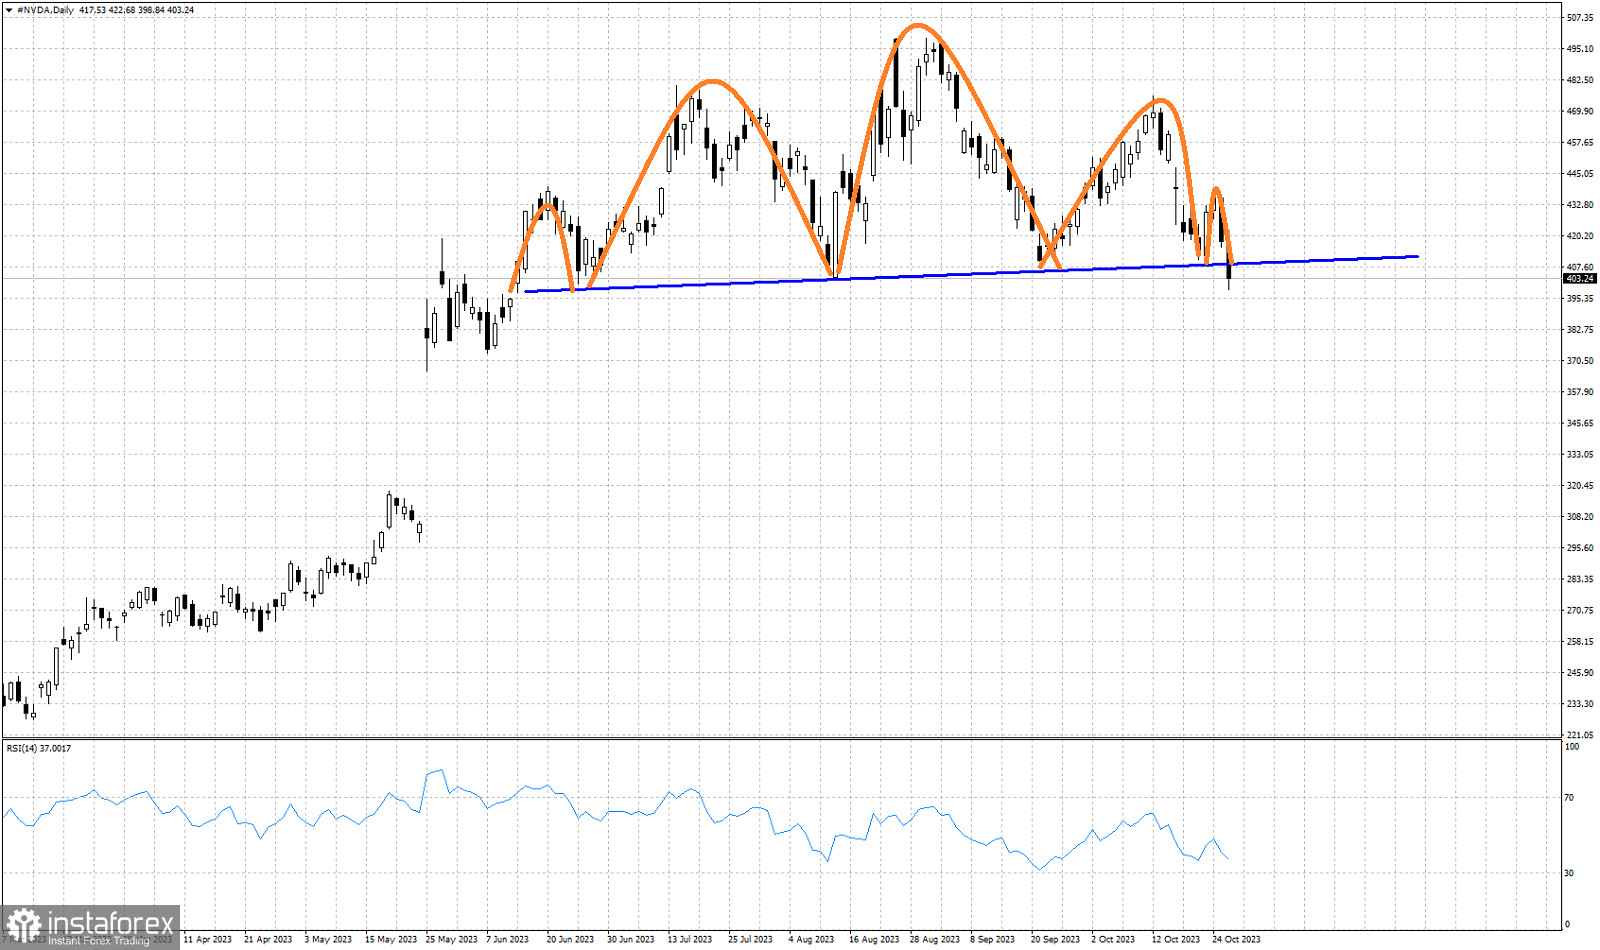
Blue line- neckline support
Orange lines- Head and shoulders pattern
NVDA stock price recently broke below the $407.50 price level pushing price to new 4 month lows. A bearish Head and Shoulders pattern has been activated in the NVDA chart as price has just broken below the neckline support. NVDA stock price is expected to be under selling pressures over the coming weeks. In order for this bearish scenario to get cancelled, we need to see price break above at least the $437 price level where the second right hand shoulder formed. Otherwise we should expect NVDA to fall towards the $320 price level.
You have already liked this post today
*The market analysis posted here is meant to increase your awareness, but not to give instructions to make a trade.


