Vea también
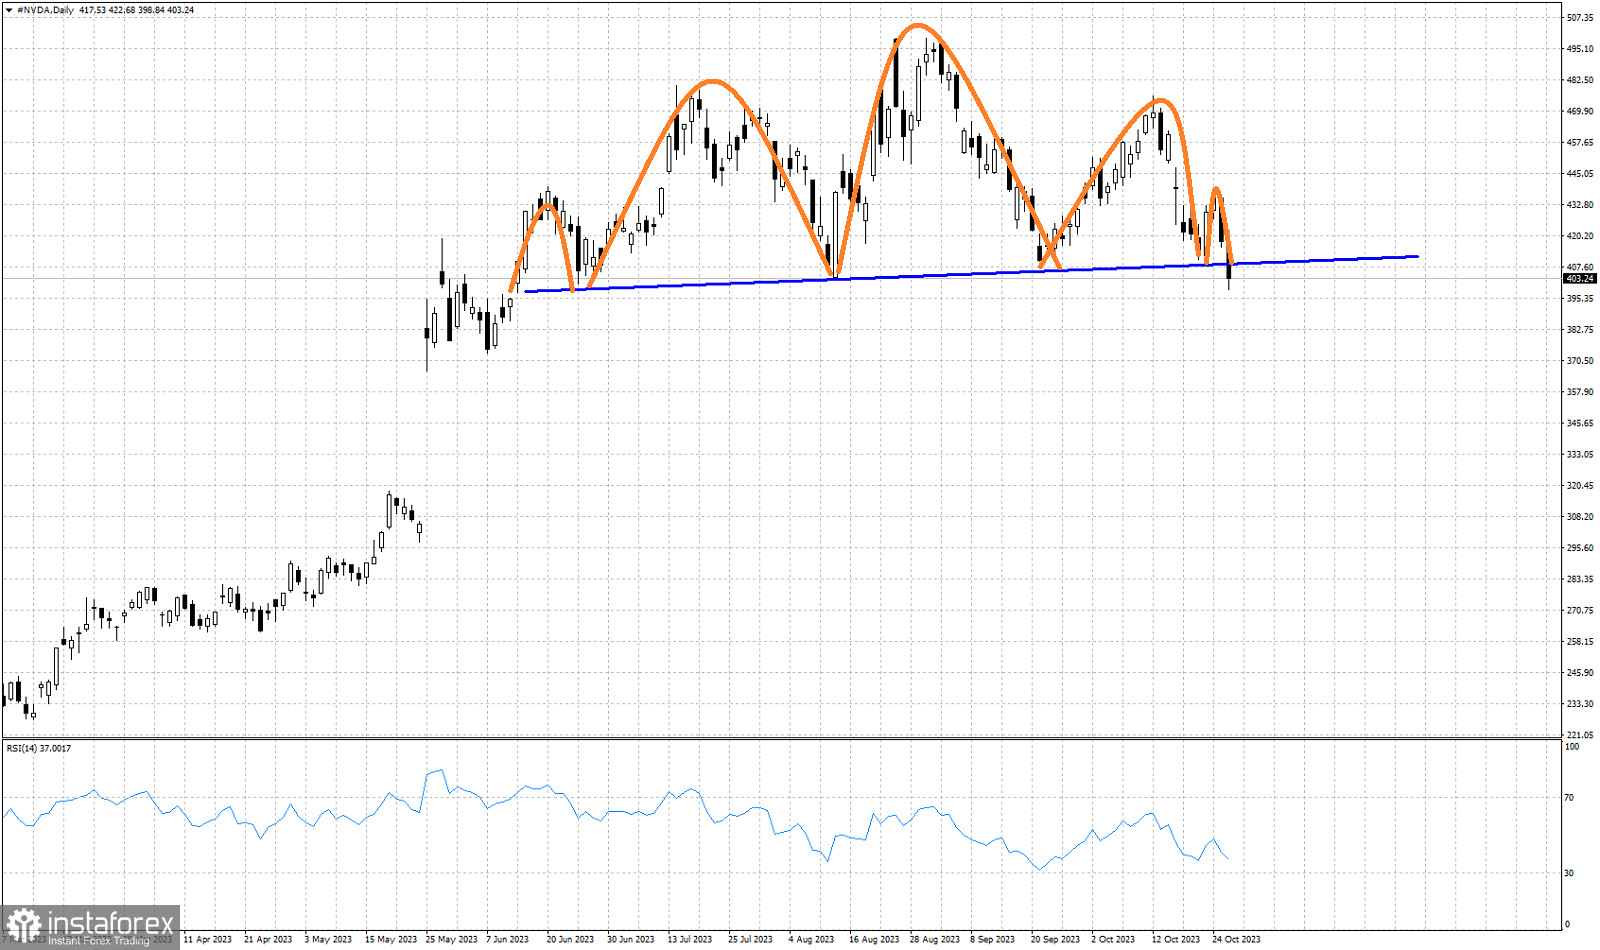
Blue line- neckline support
Orange lines- Head and shoulders pattern
NVDA stock price recently broke below the $407.50 price level pushing price to new 4 month lows. A bearish Head and Shoulders pattern has been activated in the NVDA chart as price has just broken below the neckline support. NVDA stock price is expected to be under selling pressures over the coming weeks. In order for this bearish scenario to get cancelled, we need to see price break above at least the $437 price level where the second right hand shoulder formed. Otherwise we should expect NVDA to fall towards the $320 price level.
You have already liked this post today
*El análisis de mercado publicado aquí tiene la finalidad de incrementar su conocimiento, más no darle instrucciones para realizar una operación.
Al cierre del día de ayer, los índices bursátiles estadounidenses terminaron con ganancias. El S&P 500 subió un 0,61%, y el Nasdaq 100 aumentó un 0,94%. El índice industrial
Al cierre del pasado viernes, los índices bursátiles estadounidenses terminaron al alza. El S&P 500 subió un 0,52%, mientras que el Nasdaq 100 ganó un 0,52%. El industrial Dow Jones
Club InstaForex
Your IP address shows that you are currently located in the USA. If you are a resident of the United States, you are prohibited from using the services of InstaFintech Group including online trading, online transfers, deposit/withdrawal of funds, etc.
If you think you are seeing this message by mistake and your location is not the US, kindly proceed to the website. Otherwise, you must leave the website in order to comply with government restrictions.
Why does your IP address show your location as the USA?
Please confirm whether you are a US resident or not by clicking the relevant button below. If you choose the wrong option, being a US resident, you will not be able to open an account with InstaTrade anyway.
We are sorry for any inconvenience caused by this message.