See also
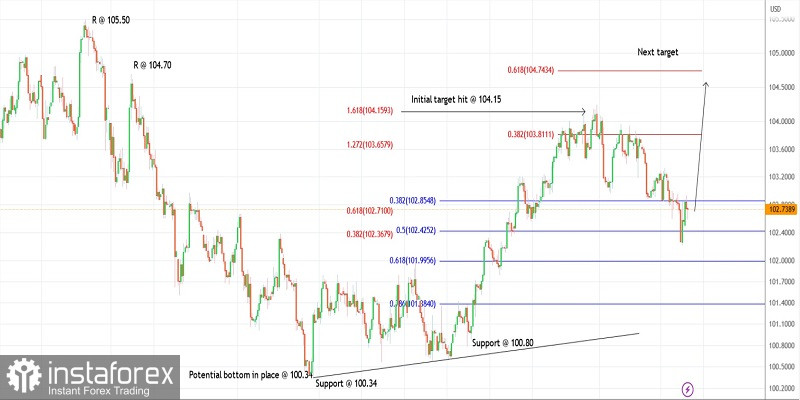
The US dollar index slipped through 102.20 on Wednesday before reversing sharply towards 102.90 post-FOMC meeting. The index is seen to be trading close to 102.75 at this point in writing as the bulls prepare to come back in control and push the instrument towards 104.75 at least. Also, note that 104.70 is the next-in-line resistance as marked on the 4H chart here.
The US dollar index is producing a larger-degree corrective wave from the 100.50 lows. It has terminated the first and second waves around the 105.50 and 100.34 levels respectively. Since then, the index has been unfolding the last wave higher towards 105.50 to complete the expanded flat pattern. Once complete, a huge bear market is expected to unfold.
The US dollar index has been progressing higher since the 100.34 lows within the larger wave projected towards 105.50. The retracement has tested 102.20 which is just below the Fibonacci 0.50 level of its recent upswing between 100.34 and 104.65 levels respectively. Immediate resistance is seen through 103.20 and a push through that will confirm that the bulls are back in control.
A potential rally towards 105.00 to resume soon
Good luck!
You have already liked this post today
*The market analysis posted here is meant to increase your awareness, but not to give instructions to make a trade.
In my morning forecast, I highlighted the 1.1749 level and planned to base market entry decisions around it. Let's look at the 5-minute chart and break down what happened
On Friday, the GBP/USD pair showed total flat movement and low volatility. As with the EUR/USD pair, there was no news that day, and no macroeconomic publications were released either
Friday Trade Analysis: EUR/USD 1H Chart The EUR/USD pair stayed flat all day Friday, with volatility totaling 36 points, clearly indicating a lack of trading activity. This is not surprising
The GBP/USD currency pair traded with low volatility and primarily moved sideways. As mentioned earlier, last week was particularly interesting in how the market interpreted various events and publications
Analysis of Thursday's Trades 1H Chart of EUR/USD The EUR/USD currency pair traded throughout Thursday, both before and after the publication of the U.S. Nonfarm Payrolls and unemployment data
Your IP address shows that you are currently located in the USA. If you are a resident of the United States, you are prohibited from using the services of InstaFintech Group including online trading, online transfers, deposit/withdrawal of funds, etc.
If you think you are seeing this message by mistake and your location is not the US, kindly proceed to the website. Otherwise, you must leave the website in order to comply with government restrictions.
Why does your IP address show your location as the USA?
Please confirm whether you are a US resident or not by clicking the relevant button below. If you choose the wrong option, being a US resident, you will not be able to open an account with InstaTrade anyway.
We are sorry for any inconvenience caused by this message.