

Актуальні патерни

Патерни - це графічні моделі, які "малюють" ціни на графіку. Один з постулатів технічного аналізу говорить нам про те, що історія (рух ціни) завжди повторюється. Це означає, що в схожих ситуаціях рух ціни, найчастіше, буде схожим, що дозволяє з високою часткою ймовірності спрогнозувати подальший розвиток ситуації.
Актуальні патерни від ІнстаФорекс - це зручний сервіс, який дозволить вам завжди бути в курсі останніх змін на ринку і вчасно реагувати на підказки, що з'явилися, від ринку. У нашому сервісі ви завжди знайдете найсвіжіші і актуальніші патерни на будь-якій парі і на будь-якому таймфреймі.
Прямоугольник
сформирован 12.06 в 18:09:06 (UTC+0)
сила сигнала 3 из 5
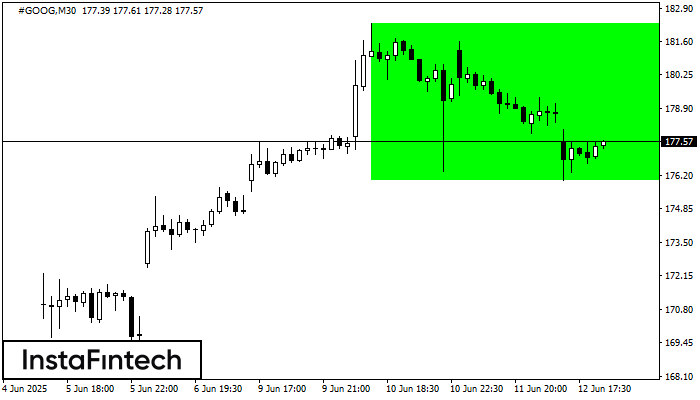
Сформирована фигура «Прямоугольник» на графике #GOOG M30. Тип фигуры: Продолжение тренда; Границы: Верхняя 182.33, Нижняя 176.00; Сигнал: позицию на покупку следует открывать выше верхней границы прямоугольника 182.33.


