Bullish Rectangle
was formed on 12.06 at 18:09:06 (UTC+0)
signal strength 3 of 5
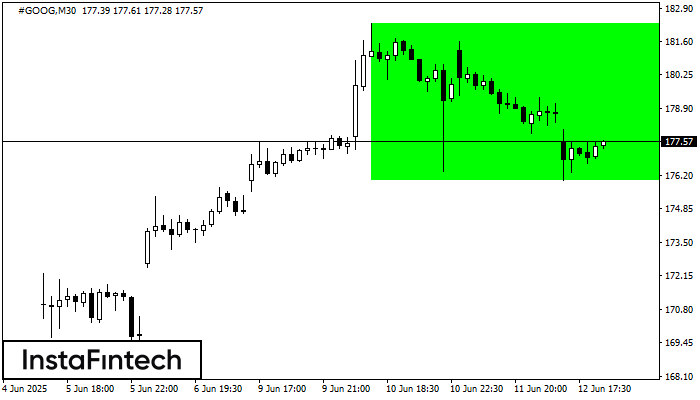
According to the chart of M30, #GOOG formed the Bullish Rectangle. The pattern indicates a trend continuation. The upper border is 182.33, the lower border is 176.00. The signal means that a long position should be opened above the upper border 182.33 of the Bullish Rectangle.
ดูเพิ่มเติม
- All
- All
- Bearish Rectangle
- Bearish Symmetrical Triangle
- Bullish Rectangle
- Double Top
- Double Top
- Triple Bottom
- Triple Bottom
- Triple Top
- Triple Top
- All
- All
- Buy
- Sale
- All
- 1
- 2
- 3
- 4
- 5
รูปแบบกราฟจุดสองยอดขาลง (Double Bottom)
was formed on 08.07 at 20:00:35 (UTC+0)
signal strength 2 of 5
รูปแบบ รูปแบบกราฟจุดสองยอดขาลง (Double Bottom) ถูกสร้างขึ้นมาใน #NTDOY M15 คุณลักษณะ: ระดับของแนวรับ 22.14; ระดับของแนวต้าน 22.25; ความกว้างของรูปแบบ 11 จุด
ขอบเตระยะเวลาใน M5 และ M15 อาจจะมีตำแหน่งการเข้าใช้งานที่ผิดพลาดมากยิ่งขึ้น
Open chart in a new window
รูปแบบกราฟจุดสองยอดขาลง (Double Bottom)
was formed on 08.07 at 20:00:35 (UTC+0)
signal strength 3 of 5
รูปแบบ รูปแบบกราฟจุดสองยอดขาลง (Double Bottom) ถูกสร้างขึ้นมาใน #NTDOY M30 คุณลักษณะ: ระดับของแนวรับ 22.14; ระดับของแนวต้าน 22.25; ความกว้างของรูปแบบ 11 จุด
Open chart in a new window
รูปแบบกราฟจุดสองยอดขาลง (Double Bottom)
was formed on 08.07 at 20:00:32 (UTC+0)
signal strength 3 of 5
รูปแบบ รูปแบบกราฟจุดสองยอดขาลง (Double Bottom) ถูกสร้างขึ้นมาใน #NTDOY M30 คุณลักษณะ: ระดับของแนวรับ 22.14; ระดับของแนวต้าน 22.25; ความกว้างของรูปแบบ 11 จุด
Open chart in a new window