empty
22.05.2025 11:51 AM
Forecast for EUR/USD on May 22, 2025

On Wednesday, the EUR/USD pair continued to rise and consolidated above the 50.0% Fibonacci retracement level at 1.1320. As a result, the euro may continue appreciating toward the next resistance zone of 1.1374–1.1380. A consolidation below 1.1320 would favor the U.S. dollar and trigger a decline toward the support zone of 1.1260–1.1282. The bullish trend is gaining momentum once again.

This image is no longer relevant

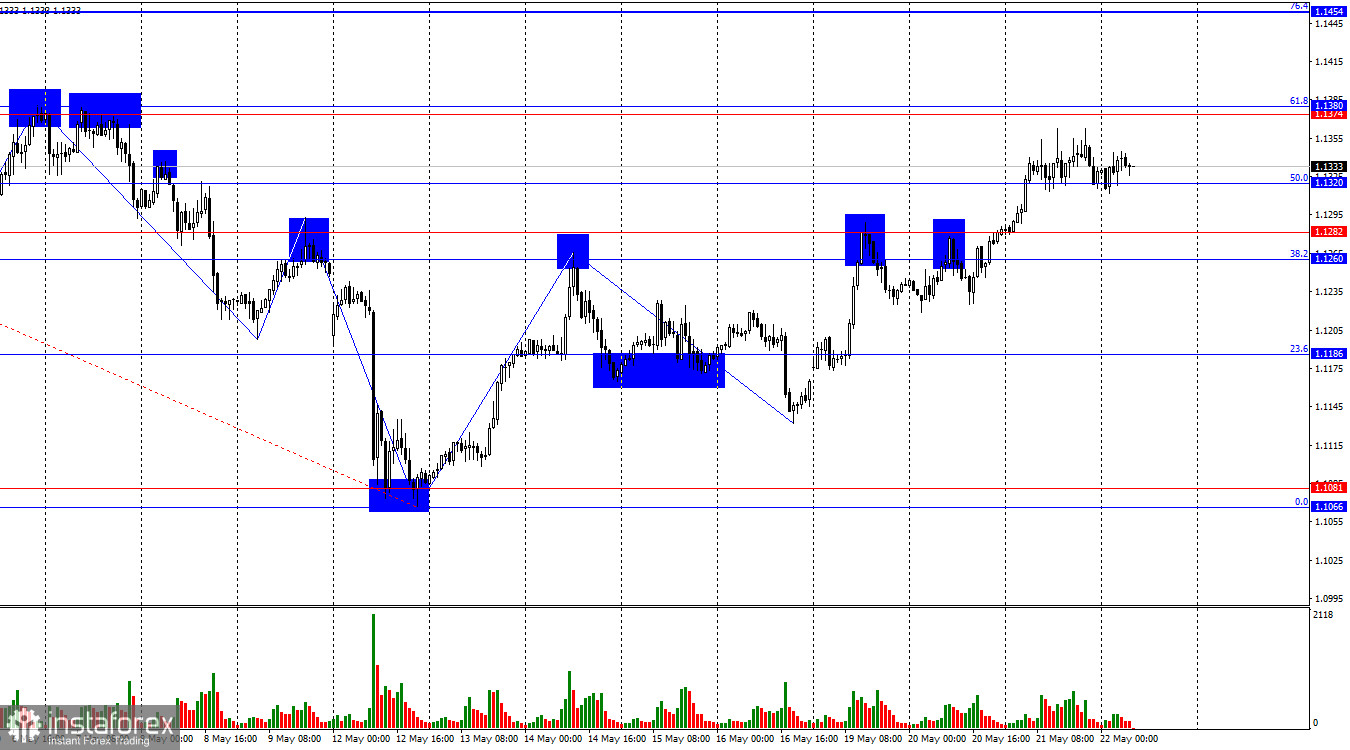
The wave structure on the hourly chart is beginning to shift. The most recent upward wave broke above the previous high, while the last completed downward wave failed to break the previous low. This confirms a transition to a bullish trend. While news about successful negotiations between the U.S. and China and a hawkish Fed stance briefly supported the bears, Donald Trump's policies are once again placing heavy pressure on the U.S. dollar.

There was no significant news on Wednesday, but overall trader sentiment remains highly negative—negative toward the dollar. Although this week's economic background gave no particular reason for the dollar to fall (mainly due to the lack of data), dollar bulls still found themselves under pressure as traders resumed their buying offensive. It is likely that the dollar's modest growth last month was driven by profit-taking from earlier short positions. Since those trades were based on selling the dollar, the currency was able to show some limited recovery. But as traders received no new data or headlines suggesting that the worst was over for the U.S. economy, government, or currency, they reverted to their prior stance. The trade war continues, negotiations with many countries are stalling, and the U.S. credit rating is being downgraded.

This image is no longer relevant

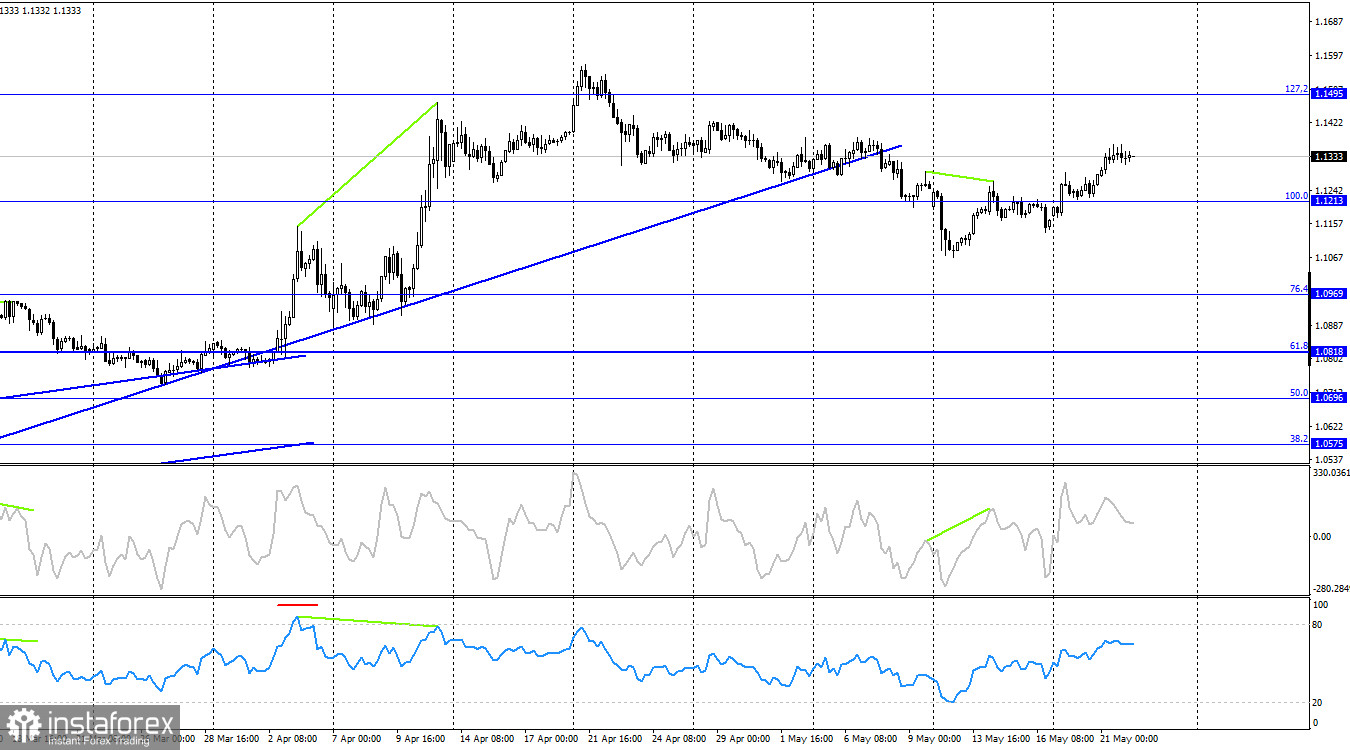
On the 4-hour chart, the pair reversed in favor of the euro and consolidated above the 100.0% Fibonacci level at 1.1213, signaling the possible resumption of the bullish trend—also confirmed by the wave structure. Growth may continue toward the 127.2% Fibonacci retracement at 1.1495. No divergences are currently forming on any indicators.

Commitments of Traders (COT) Report:

This image is no longer relevant

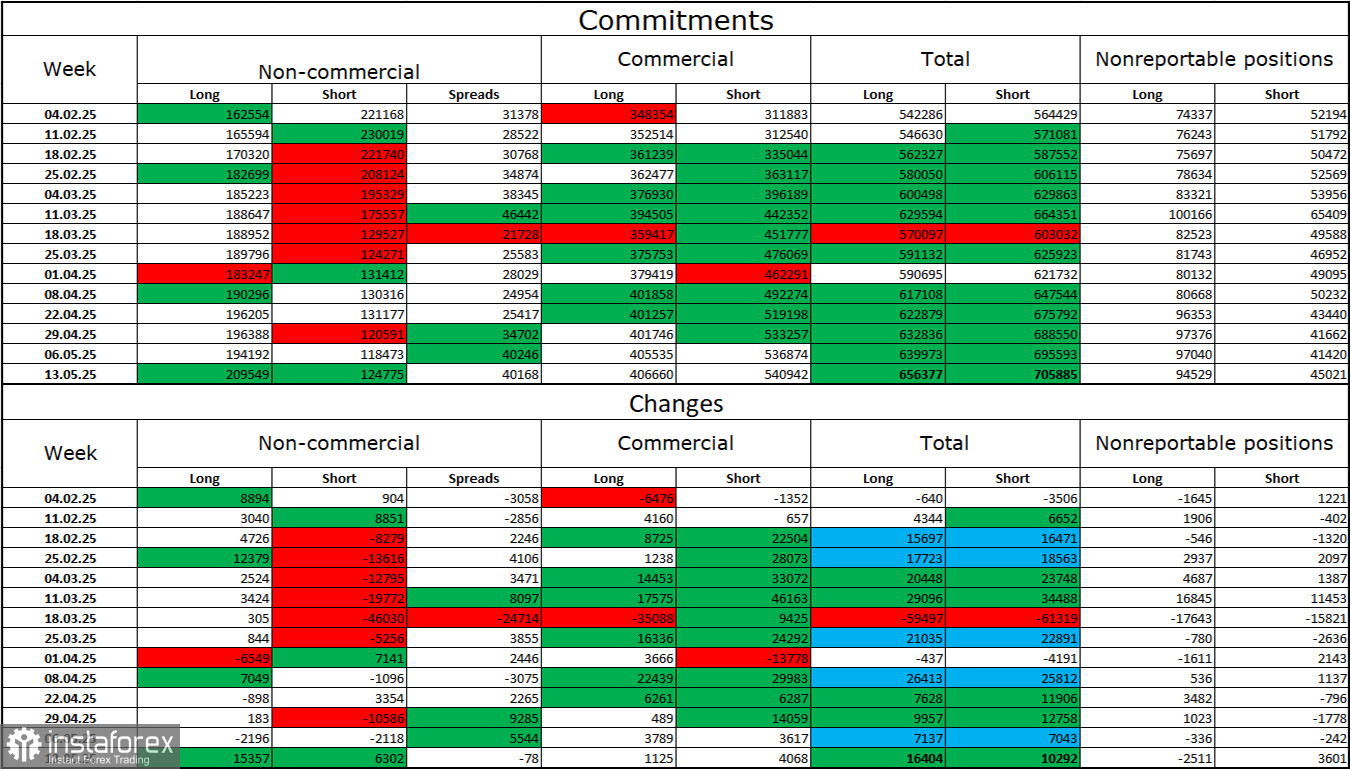
In the last reporting week, professional traders opened 15,357 long positions and 6,302 short positions. Sentiment in the "Non-commercial" category has long been bullish—thanks to Donald Trump. The total number of long positions held by speculators now stands at 209,000, while short positions total 124,000, and the gap continues to widen. The euro remains in demand, while the dollar does not. This trend remains unchanged.

For fifteen consecutive weeks, large traders have been reducing short positions and increasing longs. Despite the widening interest rate differential between the ECB and the Fed—which still favors the U.S. dollar—Trump's policies are a much more significant factor for traders, as they could trigger a recession in the American economy. As a result, dollar bulls are unable—or unwilling—to capitalize on Fed policy.

News Calendar for the U.S. and Eurozone (May 22):

Eurozone:

  • Germany Services PMI (07:30 UTC)
  • Germany Manufacturing PMI (07:30 UTC)
  • Eurozone Services PMI (08:00 UTC)
  • Eurozone Manufacturing PMI (08:00 UTC)
  • Eurozone Ifo Business Climate Index (08:00 UTC)

United States:

  • Initial Jobless Claims (12:30 UTC)
  • U.S. Services PMI (13:45 UTC)
  • U.S. Manufacturing PMI (13:45 UTC)
  • Existing Home Sales (14:00 UTC)

The economic calendar for May 22 is full of noteworthy releases, some of which may influence market sentiment throughout the day.

EUR/USD Forecast and Trader Tips:

Selling the pair is possible today on a rebound from the 1.1374–1.1380 zone on the hourly chart, with targets at 1.1320 and 1.1260–1.1282—or on a close below 1.1320. I previously recommended considering long positions on a close above 1.1265–1.1282 on the hourly chart, with targets at 1.1338 and 1.1374. The first target has already been reached, and there is no reason to close long trades just yet.

Fibonacci levels are drawn from 1.1574–1.1066 on the hourly chart and from 1.1214–1.0179 on the 4-hour chart.

Recommended Stories

Bitcoin. El fortalecimiento del dólar podría dar un giro bajista al mercado de criptomonedas

Hoy, el mercado se centrará en la publicación del informe sobre la inflación en Estados Unidos, que se espera que muestre no solo que ha dejado de bajar, sino

Pati Gani 13:12 2025-06-11 UTC+2

Bitcoin. El logro de nuevos máximos puede detenerse

El precio del Bitcoin superó momentáneamente el nuevo nivel histórico de 111 000, pero no logró consolidarse por encima de él. El apoyo proviene, tanto para él como para

Pati Gani 10:53 2025-05-22 UTC+2

EUR/USD. El 12 de mayo. El conflicto en Ucrania podría llegar a su fin.

Buenos días, estimados traders. El par EUR/USD el viernes subió hacia la zona de resistencia 1,1265 – 1,1282, rebotó desde allí y giró a favor del dólar estadounidense. El proceso

Samir Klishi 10:27 2025-05-12 UTC+2

Pronóstico para el gas al 8 de abril de 2025

Gas natural (NG) Ni al final de la semana pasada, ni mucho menos al comienzo de la actual, la cotización del gas natural logró superar la resistencia de 4.200, reforzada

Laurie Bailey 08:11 2025-04-08 UTC+2

Pronóstico del gas para el 17 de marzo de 2025

Gas natural (NG) La jornada de hoy se abrió por encima de la línea indicadora Kruzenshtern en el marco diario. Al mismo tiempo, el oscilador Marlin cambió de dirección hacia

Laurie Bailey 07:02 2025-03-17 UTC+2

Pronóstico para el Bitcoin el 21 de febrero de 2025

Bitcoin El Bitcoin ha cambiado de opinión sobre el desarrollo de una caída hacia soportes objetivos cómodos, y en su lugar, siguiendo el sentimiento de riesgo general, ha revertido desde

Laurie Bailey 07:23 2025-02-21 UTC+2

Bitcoin - análisis técnico de la situación

Viernes, y el Bitcoin sigue esperando. Ninguna de las partes enfrentadas tiene prisa por presentarse y ser activa. En la incertidumbre actual, el posicionamiento de los principales índices de referencia

Evangelos Poulakis 07:45 2025-02-14 UTC+2

Previsión para el gas natural (GN) del 5 de febrero de 2025

En el gráfico semanal la semana pasada el precio se revirtió desde el nivel de soporte 3.017 - desde los máximos de septiembre 2024, agosto 2023, febrero 2023 y también

Laurie Bailey 07:51 2025-02-05 UTC+2

#NDX - análisis técnico de la situación

A finales del año pasado, el índice marcó un nuevo máximo histórico (22141), tras lo cual se detuvo la subida, comenzó la formación de la corrección y la consolidación. Ahora

Evangelos Poulakis 07:24 2025-02-04 UTC+2

Bitcoin 30 Enero - análisis técnico de la situación

A pesar de marcar un nuevo máximo la semana pasada (109986), el Bitcoin detuvo su tendencia alcista y comenzó a formar incertidumbre. Hasta ahora, el formato semanal ha proyectado

Evangelos Poulakis 07:24 2025-01-30 UTC+2
¿No puede hablar ahora mismo?
Ingrese su pregunta en el chat.
 

Dear visitor,

Your IP address shows that you are currently located in the USA. If you are a resident of the United States, you are prohibited from using the services of InstaFintech Group including online trading, online transfers, deposit/withdrawal of funds, etc.

If you think you are seeing this message by mistake and your location is not the US, kindly proceed to the website. Otherwise, you must leave the website in order to comply with government restrictions.

Why does your IP address show your location as the USA?

  • - you are using a VPN provided by a hosting company based in the United States;
  • - your IP does not have proper WHOIS records;
  • - an error occurred in the WHOIS geolocation database.

Please confirm whether you are a US resident or not by clicking the relevant button below. If you choose the wrong option, being a US resident, you will not be able to open an account with InstaTrade anyway.

We are sorry for any inconvenience caused by this message.