Vea también

 27.02.2024 09:14 AM
Trend analysis (Fig. 1).
The GBP/USD currency pair may move downward from the level of 1.2681 (closing of yesterday's daily candle) to test the 61.8% pullback level at 1.2674 (blue dotted line). Upon reaching this level, an upward movement is possible, with a target of testing the 76.4% pullback level at 1.2711 (blue dotted line).
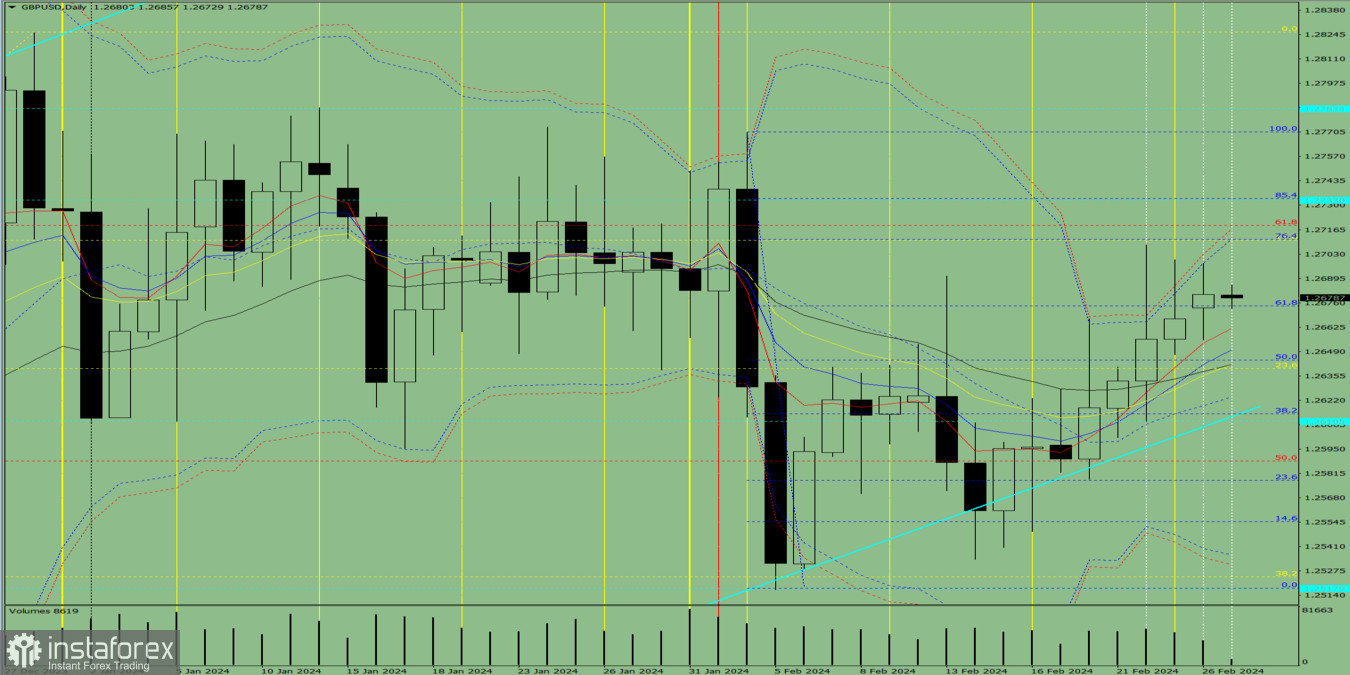
Fig. 1 (daily chart).
Comprehensive analysis:
General conclusion: Today, the price may move downward from the level of 1.2681 (closing of yesterday's daily candle) to test the 61.8% pullback level at 1.2674 (blue dotted line). Upon reaching this level, an upward movement is possible, with a target of testing the 76.4% pullback level at 1.2711 (blue dotted line).
Alternatively, from the level of 1.2681, the price may move downward to test 1.2662, the 5-period EMA (red thin line). Upon reaching this level, the price may move upward with the target of testing the 76.4% pullback level at 1.2711 (blue dotted line).
You have already liked this post today
*El análisis de mercado publicado aquí tiene la finalidad de incrementar su conocimiento, más no darle instrucciones para realizar una operación.


