empty
27.02.2024 09:14 AM
Indicator Analysis of GBP/USD on February 27, 2024

Trend analysis (Fig. 1).

The GBP/USD currency pair may move downward from the level of 1.2681 (closing of yesterday's daily candle) to test the 61.8% pullback level at 1.2674 (blue dotted line). Upon reaching this level, an upward movement is possible, with a target of testing the 76.4% pullback level at 1.2711 (blue dotted line).

This image is no longer relevant

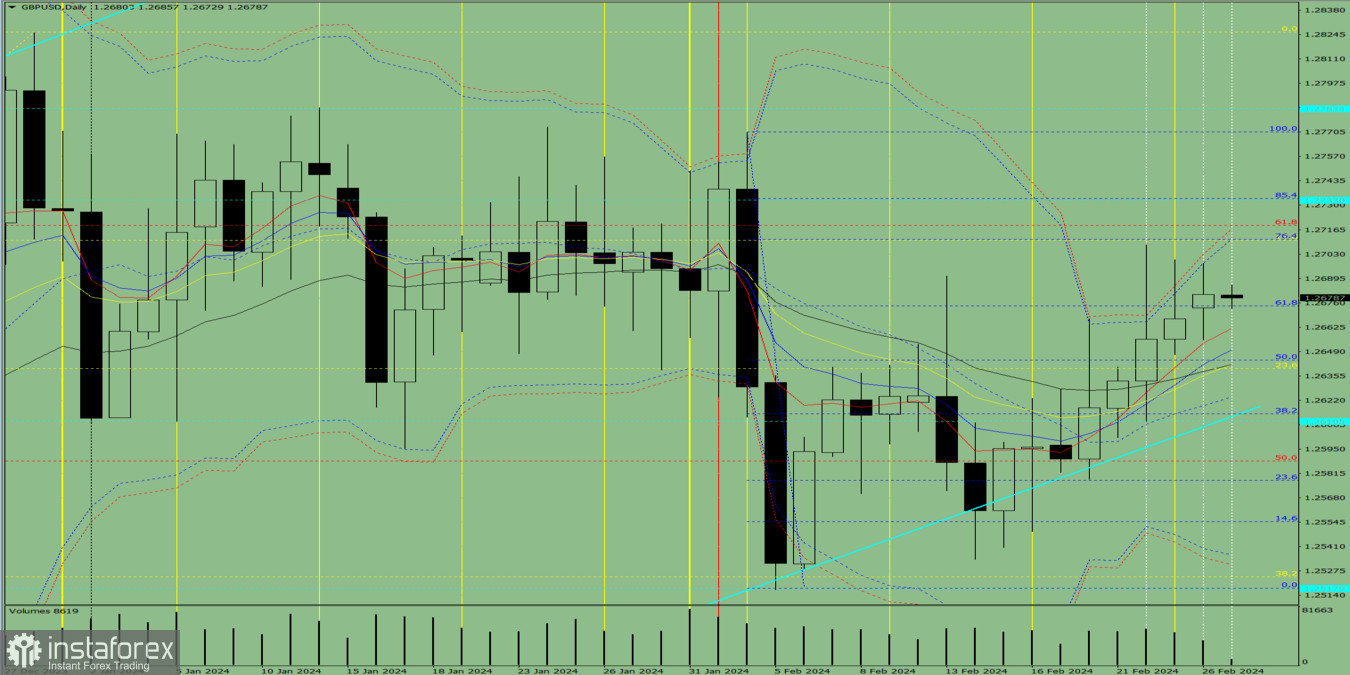
Fig. 1 (daily chart).

Comprehensive analysis:

  • Indicator analysis – down;
  • Volumes – down;
  • Candlestick analysis – down;
  • Trend analysis – up;
  • Bollinger bands – down;
  • Weekly chart – up.

General conclusion: Today, the price may move downward from the level of 1.2681 (closing of yesterday's daily candle) to test the 61.8% pullback level at 1.2674 (blue dotted line). Upon reaching this level, an upward movement is possible, with a target of testing the 76.4% pullback level at 1.2711 (blue dotted line).

Alternatively, from the level of 1.2681, the price may move downward to test 1.2662, the 5-period EMA (red thin line). Upon reaching this level, the price may move upward with the target of testing the 76.4% pullback level at 1.2711 (blue dotted line).

Recommended Stories

GBP/USD. 8 अगस्त. बैंक ऑफ इंग्लैंड के फैसले से पाउंड पर ज़्यादा असर नहीं पड़ा

प्रति घंटा चार्ट पर, GBP/USD जोड़ी गुरुवार को बढ़ती रही और 1.3357–1.3371 के प्रतिरोध क्षेत्र और 1.3425 के स्तर से ऊपर समेकित हुई। इस प्रकार, शुक्रवार को, यह ऊपर की

Samir Klishi 19:04 2025-08-08 UTC+2

GBP/USD – 7 अगस्त। बैंक ऑफ इंग्लैंड पाउंड को सहारा देने की तैयारी में है

प्रति घंटा चार्ट पर, GBP/USD जोड़ी बुधवार को 1.3258 पर 127.2% फिबोनाची रिट्रेसमेंट स्तर से उछलकर 1.3357–1.3371 के प्रतिरोध क्षेत्र तक पहुँच गई। इस क्षेत्र से उछाल अमेरिकी डॉलर के

Samir Klishi 19:22 2025-08-07 UTC+2

हालांकि प्रवृत्ति मजबूत बनी हुई है, नैस्डैक 100 इंडेक्स पर डाइवर्जेंस के प्रकट होने से सीमित सुधार की संभावना है। गुरुवार, 7 अगस्त, 2025।

नैस्डैक 100 इंडेक्स - गुरुवार, 7 अगस्त, 2025 EMA (50) और EMA (200) के गोल्डन क्रॉस बनने की स्थिति के साथ, और RSI (14) अत्यधिक तेजी वाले क्षेत्र में होने

Arief Makmur 12:50 2025-08-07 UTC+2

चांदी में आज भी अपनी ताकत बढ़ाने की संभावना है और यह अपने निकटतम प्रतिरोध स्तर तक पहुंच सकती है। गुरुवार, 7 अगस्त, 2025।

चांदी – गुरुवार, 7 अगस्त, 2025 चांदी की प्रवृत्ति वर्तमान में काफी मजबूत हो रही है, और यह संभावित रूप से अपने निकटतम प्रतिरोध स्तरों का परीक्षण कर रही है।

Arief Makmur 12:47 2025-08-07 UTC+2

AUD/USD में मजबूती की संभावना है कि यह कमोडिटी करेंसी 0.8137 तक पहुँच जाए। बुधवार, 6 अगस्त 2025।

AUD/USD – 6 अगस्त 2025 EMA (50) की स्थिति EMA (200) के ऊपर चलने लगी है, और RSI (14) संकेतक अत्यधिक बुलिश स्तर पर है, जो RSI (14) और मूल्य

Arief Makmur 11:54 2025-08-06 UTC+2

RSI(14) संकेतक और USD/CHF मूल्य गति के बीच बन रही डाइवर्जेंस यह संकेत देती है कि विक्रेताओं की दोबारा एंट्री हो रही है। बुधवार, 6 अगस्त 2025।

USD/CHF – बुधवार, 6 अगस्त 2025 मूल्य गति और RSI(14) संकेतक के बीच डाइवर्जेंस के प्रकट होने के साथ, जो कि एक Bearish Neutral स्थिति में है, और दो

Arief Makmur 11:52 2025-08-06 UTC+2

EUR/USD. 5 अगस्त, 2025 के लिए संकेतक विश्लेषण और दैनिक अवलोकन

सोमवार को, यह जोड़ी नीचे की ओर बढ़ी, 1.1549 (पीली धराशायी रेखा) पर 38.2% रिट्रेसमेंट स्तर को पार कर गई, और दैनिक कैंडल 1.1570 पर बंद हुई। आज, प्रमुख अमेरिकी

Stefan Doll 19:32 2025-08-05 UTC+2

GBP/USD – 4 अगस्त: क्या पाउंड को डॉलर की गिरावट से लाभ होगा?

प्रति घंटा चार्ट पर, GBP/USD जोड़ी शुक्रवार को ब्रिटिश पाउंड के पक्ष में पलट गई और 127.2% फिबोनाची स्तर से ऊपर 1.3258 पर समेकित हुई। इस प्रकार, सोमवार को

Samir Klishi 19:20 2025-08-04 UTC+2

GBP/USD. 4-9 अगस्त के सप्ताह के लिए तकनीकी विश्लेषण

पिछले हफ़्ते, यह जोड़ी नीचे की ओर बढ़ी और 1.3141 (लाल धराशायी रेखा) पर 38.2% रिट्रेसमेंट स्तर का परीक्षण किया, जिसके बाद कीमत ऊपर की ओर बढ़ी और साप्ताहिक कैंडल

Stefan Doll 19:18 2025-08-04 UTC+2

1 से 4 अगस्त, 2025 के लिए गोल्ड (XAU/USD) के ट्रेडिंग सिग्नल: $3,281 (21 SMA - 4/8 Murray) से ऊपर खरीदें।

अगर गोल्ड को 4/8 मरे स्तर के आसपास मजबूत समर्थन मिलता है, तो हमें लगता है कि एक सुधार संभव है, जो संभावित रूप से 6/8 मरे स्तर लगभग 3,359

Dimitrios Zappas 11:52 2025-08-01 UTC+2
अभी बात नहीं कर सकते?
अपना प्रश्न पूछें बातचीत.
 

Dear visitor,

Your IP address shows that you are currently located in the USA. If you are a resident of the United States, you are prohibited from using the services of InstaFintech Group including online trading, online transfers, deposit/withdrawal of funds, etc.

If you think you are seeing this message by mistake and your location is not the US, kindly proceed to the website. Otherwise, you must leave the website in order to comply with government restrictions.

Why does your IP address show your location as the USA?

  • - you are using a VPN provided by a hosting company based in the United States;
  • - your IP does not have proper WHOIS records;
  • - an error occurred in the WHOIS geolocation database.

Please confirm whether you are a US resident or not by clicking the relevant button below. If you choose the wrong option, being a US resident, you will not be able to open an account with InstaTrade anyway.

We are sorry for any inconvenience caused by this message.