
Veja também


 13.07.2026 06:48 AM
Bitcoin has recovered to $6,000 and is likely to continue moving toward the only bearish FVG on the daily chart. In this case, we can expect an additional rise of $3,000 to $4,000. However, it should be noted that any rise in Bitcoin at this time is a correction, and the correction can end at any moment. Overall, Bitcoin continues to trade near its annual lows, and most independent, unbiased experts predict further declines. We fully agree with these forecasts and believe that the downtrend is not over. Based on historical data (which is not always correct), Bitcoin usually corrects for 12-15 months after completing a bullish trend, during which it loses 75-90% of its value. So far, 9.5 months have passed since the formation of the new ATH, and Bitcoin has fallen by just over 50%. Therefore, there is still room for "digital gold" to drop further. There are no signs of the bearish trend ending: no bullish patterns, no break in the bearish structure. The fundamental backdrop also remains negative: the Fed is unlikely to lower the key rate anytime soon, capital continues to flow into the AI sector, spot demand for Bitcoin remains weak, geopolitics is unstable, and miners are adjusting their equipment to meet artificial intelligence requirements.
In the meantime, it has become known that so-called treasury companies have practically stopped buying Bitcoin. The capitalization of such companies has fallen from $400 billion to $272 billion since last October, but the number of coins on their balances has increased from 950,000 to 1.14 million. Thus, the conclusion is clear. Companies continued to buy Bitcoin at any price, resulting in nearly $100 billion in losses. It should be noted that Strategy consistently invested funds in Bitcoin with little concern for entry points. Bitcoin was bought at any price with any funds, including borrowed ones. Traders can now see the consequences of this. For the first time in 6 years, Strategy is forced to sell "digital gold" to bolster dollar reserves to pay dividends on stock shares, the proceeds of which were directed toward buying Bitcoin.
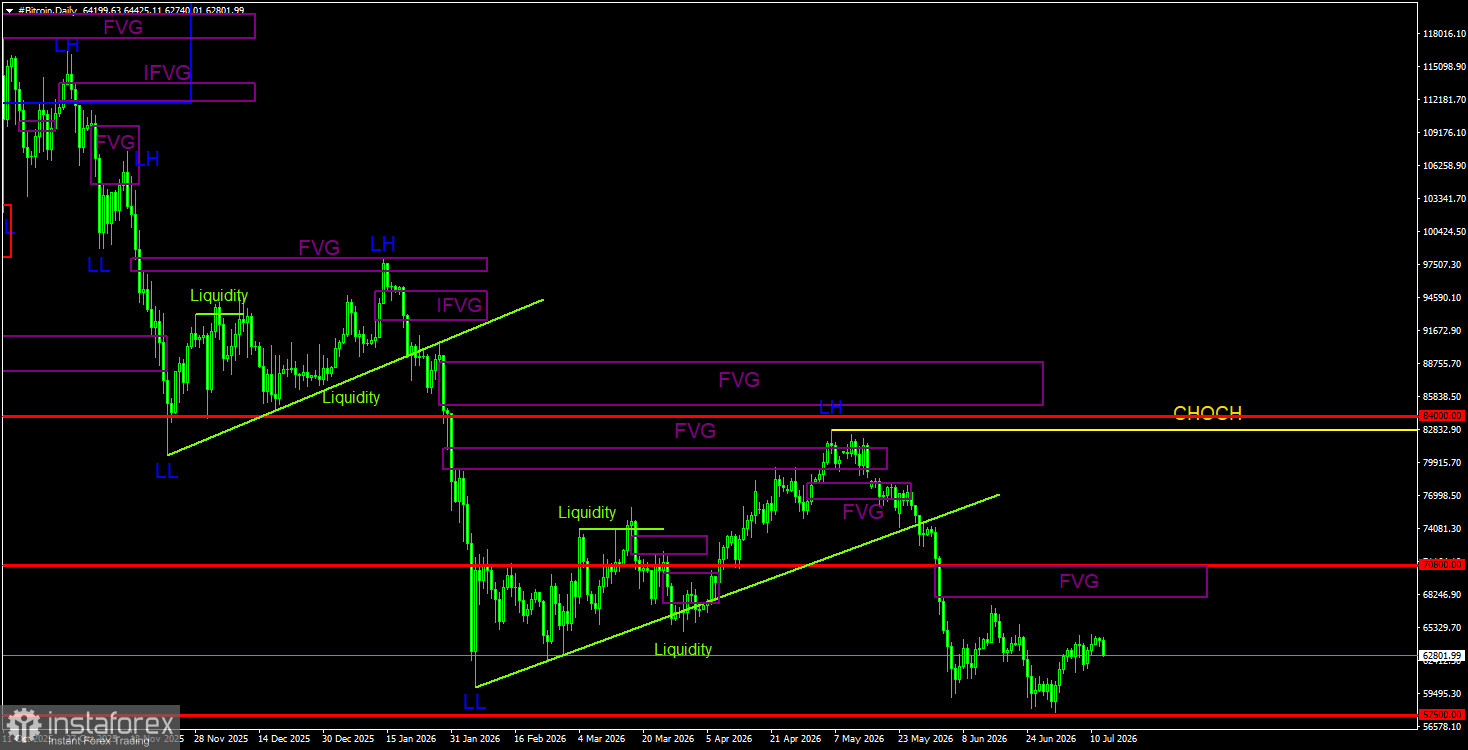
On the daily timeframe, Bitcoin continues to form a downward trend. The trend structure is identified as bearish, and the CHOCH line has been set at $82,800, as a new LL (Lower Low) has formed. Only above this level can we consider the downward trend finished. Since there are still no signs of an upward trend reversal, we believe the decline will continue. On the daily timeframe, a bearish FVG has formed in the $68,000–$70,700 range. New sell signals may be formed within this pattern. However, this pattern has not yet been executed.
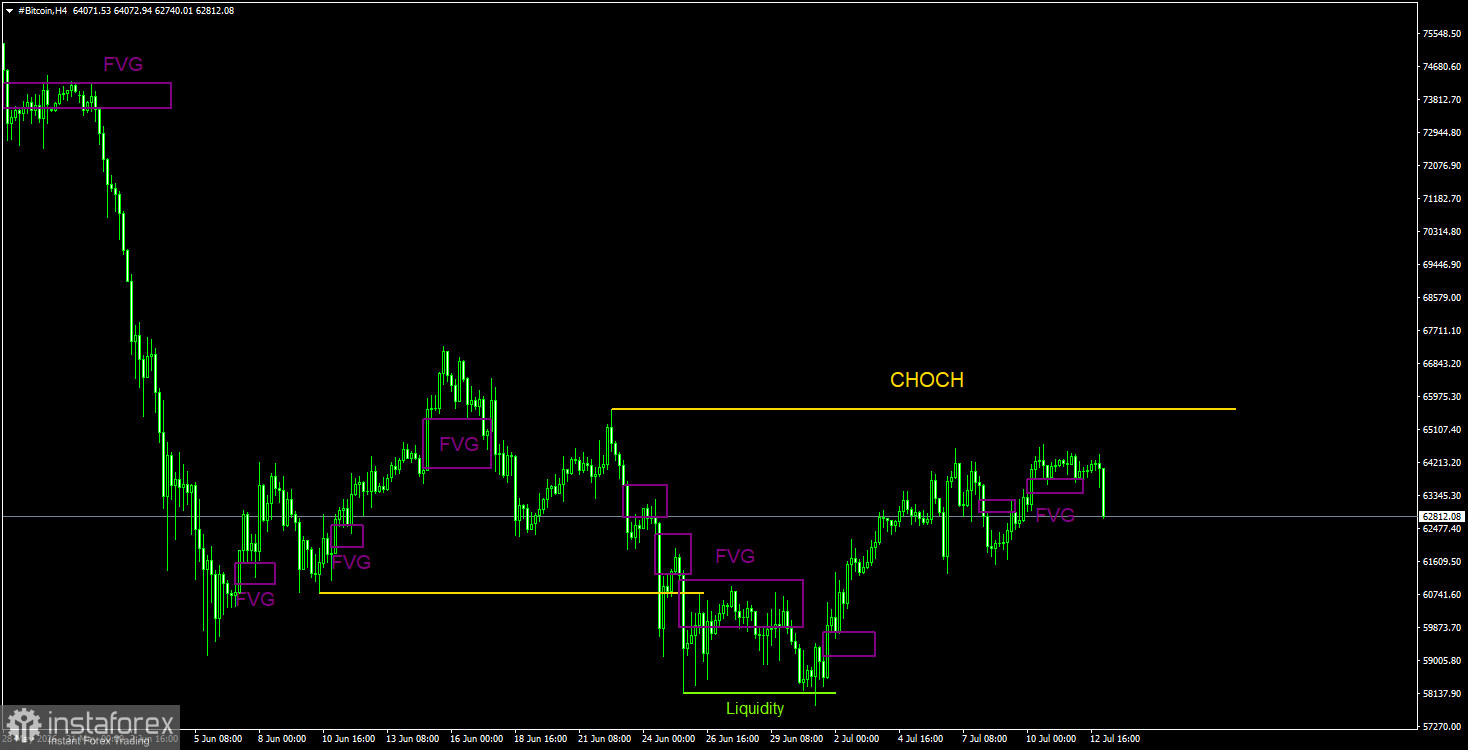
On the 4-hour timeframe, Bitcoin is in a downward trend, although the overall correction may not be complete. The CHOCH line supporting the correction has been breached. The CHOCH line, which supports the new downward trend, is at $65,600. After the liquidity for purchases was removed, a rise began, as we had warned. Recently, only small, local FVGS have been forming, and the reaction to them has typically been very weak.
Bitcoin continues to form a full-fledged downward trend. We continue to expect a decline toward $57,500 (the 61.8% Fibonacci level from a three-year upward trend), although this level has already been largely realized. However, we do not believe that the downward trend will end there. The last bearish FVG formed in the $68,000 – $70,700 range on the daily timeframe, so this area serves as a POI (Point of Interest) for short positions in the coming weeks. On the 4-hour timeframe, Bitcoin is still undergoing the second wave of correction, but sell trades remain more attractive as any rise is essentially a correction. Currently, there are no relevant patterns on the 4-hour timeframe.
CHOCH – break in trend structure.
Liquidity – Stop Loss, pending orders that market makers use to build their positions.
FVG – Fair Value Gap. Price moves quickly through these areas, indicating a complete lack of one side in the market. Subsequently, the price tends to return and react from such areas in continuation of the main trend.
IFVG – Inverted Fair Value Gap. After returning to such an area, the price does not react and impulsively breaks through, testing from the other side.
OB – Order Block. A candlestick on which the market maker opened a position with the aim of gaining liquidity to form their own position in the opposite direction.


