empty
23.12.2024 12:34 AM
GOLD – Weekly Summary and Outlook

GOLD

This image is no longer relevant

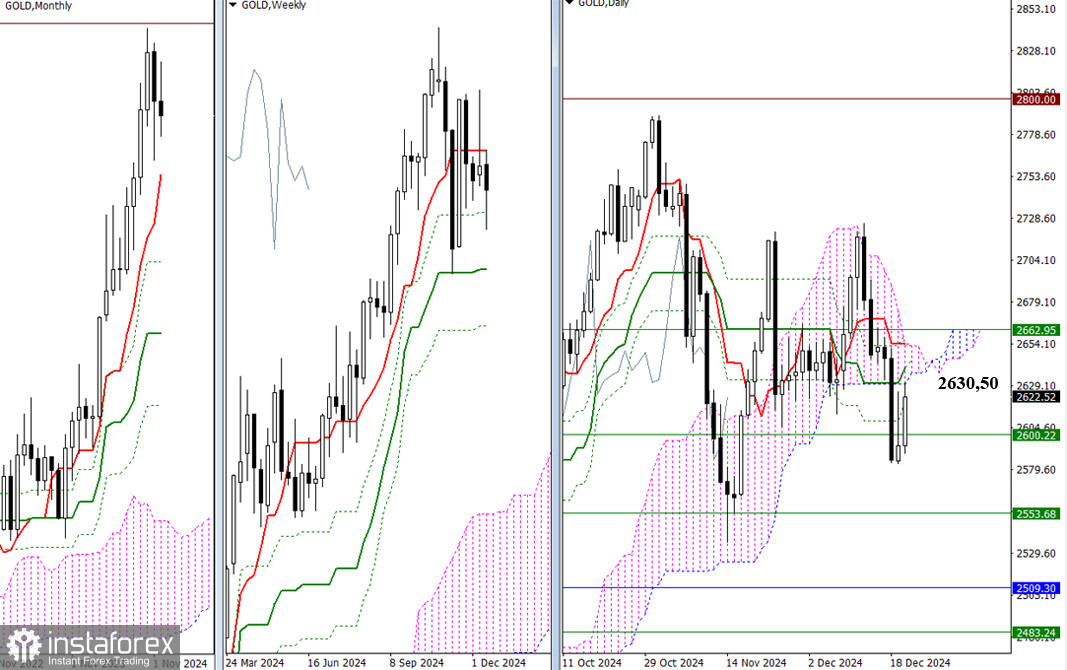
Gold spent the past week in a zone of uncertainty, failing to break through the weekly support level at 2600.22 or to negate the daily golden cross. Similarly, it could not escape the pull of the daily cloud at 2630.50. By the week's close, gold had returned below a wide resistance zone (2630.50 – 2662.95), encompassing the daily Ichimoku cloud, the key levels of the daily Ichimoku cross, and the weekly short-term trend.

A consolidation above this resistance zone would allow bullish players to explore new targets, such as 2725.57 (the nearest maximum extremum) and 2789.61 – 2800.00 (the record high and the subsequent psychological level). However, if bullish attempts fail and bearish sentiment strengthens, the market will likely shift its focus to downside targets. These targets include the weekly Ichimoku golden cross levels (2600.22 – 2553.68 – 2483.24) and the monthly short-term trend at 2509.30.

It is important to note that weekly levels may be adjusted when the market opens.

This image is no longer relevant

H4 – H1

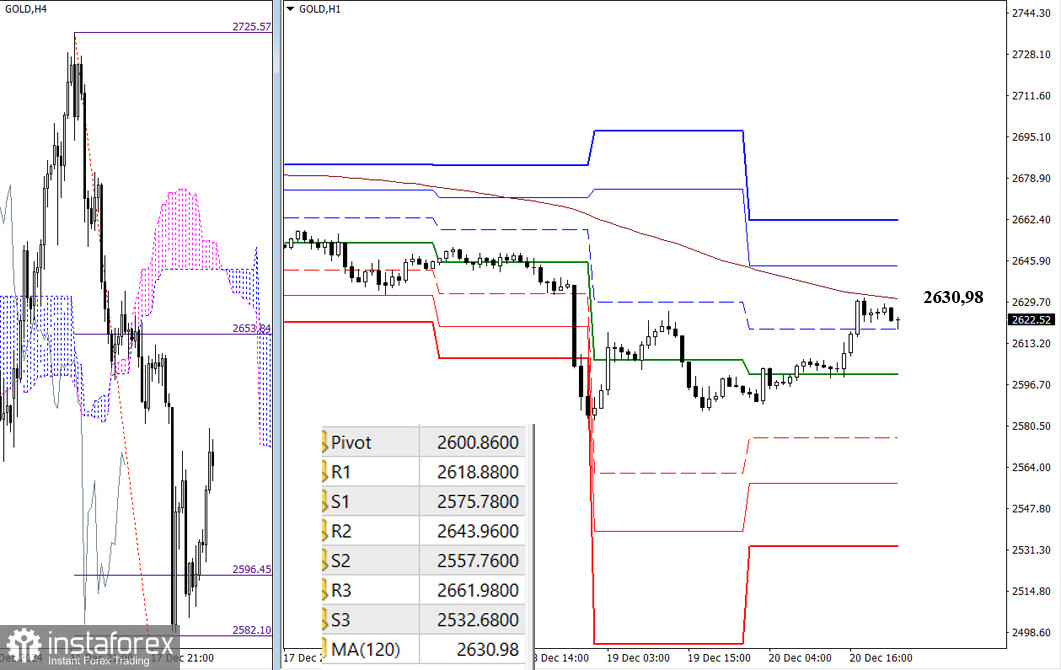
In the lower timeframes, bearish players fell short of achieving a 100% fulfillment of the target for breaking through the H4 Ichimoku cloud before the current corrective rise. Therefore, the H4 target can generally be considered fulfilled. Currently, the market is testing the most critical level on the lower timeframes: the weekly long-term trend at 2630.98. Control of this level will determine market sentiment, so working above 2630.98 will support the trend to bearish players, and a rebound and further decline would reinforce bearish sentiment. Key intraday targets will be determined by classic Pivot Points, with updated levels and positioning available, which you will need to focus on once trading begins.

***

Technical Analysis Components:
  • Higher Timeframes: Ichimoku Kinko Hyo (9.26.52) + Fibonacci Kijun levels
  • H1: Classic Pivot Points + Moving Average 120 (weekly long-term trend)

Recommended Stories

یو ایس ڈی / جے پی وائے : تجزیہ اور پیشن گوئی

یو ایس ڈی / جے پی وائے جوڑا تین ہفتے کی بلند ترین سطح کے قریب استحکام کے مرحلے میں ہے، جسے امریکی ڈالر کی مضبوطی اور مخلوط مارکیٹ سگنلز

Irina Yanina 14:47 2025-07-14 UTC+2

جی بی پی / یو ایس ڈی کی پیشن گوئی برائے 11 جولائی 2026

گھنٹہ وار چارٹ پر، جمعرات کو جی بی پی / یو ایس ڈی پئیر 1.3611–1.3633 کے مزاحمتی زون سے واپس آیا اور 1.3527 پر 127.2% فیبوناچی سطح کی طرف اپنی

Samir Klishi 20:10 2025-07-11 UTC+2

یورو / یو ایس ڈی کی پیشن گوئی برائے 11 جولائی 2025

جمعرات کو، یورو / یو ایس ڈی پئیر نے 1.1645 کی سطح کی طرف اپنی کمی جاری رکھی، جبکہ 1.1712 پر 127.2% فیبوناچی تصحیحی سطح کو تاجروں

Samir Klishi 19:59 2025-07-11 UTC+2

جولائی 10 2025 کو یورو / یو ایس ڈی کے لیے پیشن گوئی

بدھ کے روز، یورو / یو ایس ڈی پئیر ایک ایسے راستے کے ساتھ آگے بڑھتا رہا جو صرف خود کو معلوم تھا۔ 1.1712 پر 127.2% فیبوناچی تصحیح

Samir Klishi 14:23 2025-07-10 UTC+2

جی بی پی / جے پی وائے تجزیہ، پیشن گوئی، اور موجودہ مارکیٹ کی صورتحال

جمعرات کو، جی بی پی / جے پی وائے جوڑا دوبارہ اوپر کی رفتار حاصل کر رہا ہے اور مزید ترقی کے لیے تیاری ظاہر کرتا ہے۔ ایک چڑھتے ہوئے

Irina Yanina 14:14 2025-07-10 UTC+2

این ذیڈ ڈی / یو ایس ڈی ۔ تجزیہ، پیشن گوئی، اور موجودہ مارکیٹ کی صورتحال

این ذیڈ ڈی / یو ایس ڈی جوڑا فی الحال 0.6000 کی نفسیاتی سطح سے اوپر ٹریڈ کر رہا ہے۔ تاہم، یہ وسیع البنیاد امریکی ڈالر کی طاقت کے درمیان

Irina Yanina 14:46 2025-07-09 UTC+2

اے یو ڈی / جے پی وائے : تجزیہ اور جائزہ

منگل کو، اے یو ڈی / جے پی وائے جوڑے نے پراعتماد ترقی دکھائی، جو کہ ریزرو بینک آف آسٹریلیا (آر بی اے) کے سود کی شرح کو غیر تبدیل

Irina Yanina 15:39 2025-07-08 UTC+2

ایکس اے یو / یو ایس ڈی : تجزیہ، پیشن گوئی، اور موجودہ مارکیٹ کی صورتحال

سونا آج انٹرا ڈے ٹون میں مندی کو برقرار رکھے ہوئے ہے۔ روزانہ چارٹ پر آسکیلیٹر ابھی منفی رفتار دکھانا شروع کر رہے ہیں، جو دھات کی قیمت میں مزید

Irina Yanina 14:25 2025-07-07 UTC+2

جی بی پی / یو ایس ڈی : سٹرلنگ سپورٹ حاصل کرنا بند کر سکتا ہے۔

جیسا کہ پہلے متعدد مواقع پر ذکر کیا گیا ہے، غیر ملکی کرنسی (فاریکس) مارکیٹ میں امریکی ڈالر کے مقابلے میں تجارت کی جانے والی بڑی کرنسیوں کی طاقت

Pati Gani 15:00 2025-07-03 UTC+2

یو ایس ڈی / جے پی وائے ۔ تجزیہ، پیشن گوئی، اور موجودہ مارکیٹ کی صورتحال

یہ کہ 4 گھنٹے کے چارٹ پر موجود منفی آسکیلیٹر اس بات کی نشاندہی کرتے ہیں کہ مزید اوپر کی حرکت کو فروخت کے موقع کے طور پر دیکھا

Irina Yanina 19:37 2025-07-02 UTC+2
ابھی فوری بات نہیں کرسکتے ؟
اپنا سوال پوچھیں بذریعہ چیٹ.
 

Dear visitor,

Your IP address shows that you are currently located in the USA. If you are a resident of the United States, you are prohibited from using the services of InstaFintech Group including online trading, online transfers, deposit/withdrawal of funds, etc.

If you think you are seeing this message by mistake and your location is not the US, kindly proceed to the website. Otherwise, you must leave the website in order to comply with government restrictions.

Why does your IP address show your location as the USA?

  • - you are using a VPN provided by a hosting company based in the United States;
  • - your IP does not have proper WHOIS records;
  • - an error occurred in the WHOIS geolocation database.

Please confirm whether you are a US resident or not by clicking the relevant button below. If you choose the wrong option, being a US resident, you will not be able to open an account with InstaTrade anyway.

We are sorry for any inconvenience caused by this message.