empty
23.12.2024 12:34 AM
GOLD – Weekly Summary and Outlook

GOLD

This image is no longer relevant

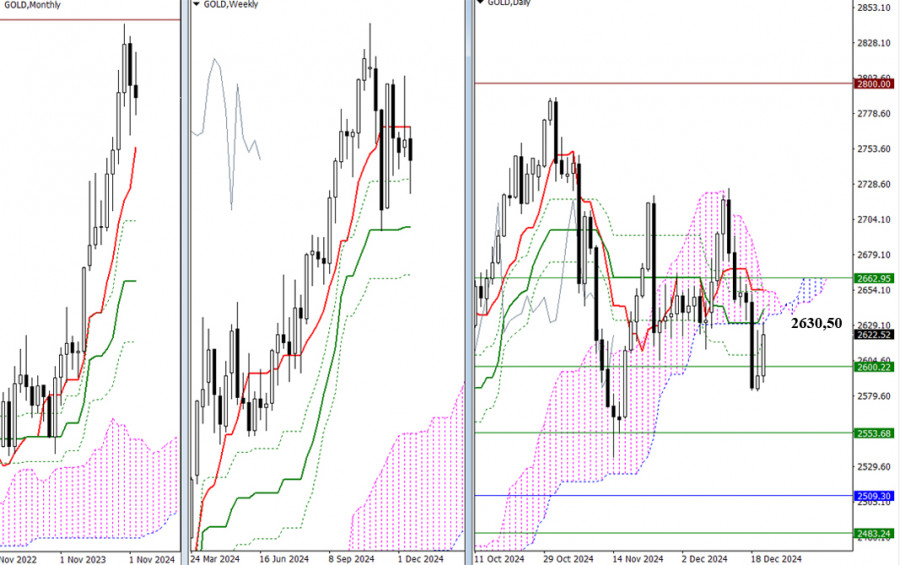
Gold spent the past week in a zone of uncertainty, failing to break through the weekly support level at 2600.22 or to negate the daily golden cross. Similarly, it could not escape the pull of the daily cloud at 2630.50. By the week's close, gold had returned below a wide resistance zone (2630.50 – 2662.95), encompassing the daily Ichimoku cloud, the key levels of the daily Ichimoku cross, and the weekly short-term trend.

A consolidation above this resistance zone would allow bullish players to explore new targets, such as 2725.57 (the nearest maximum extremum) and 2789.61 – 2800.00 (the record high and the subsequent psychological level). However, if bullish attempts fail and bearish sentiment strengthens, the market will likely shift its focus to downside targets. These targets include the weekly Ichimoku golden cross levels (2600.22 – 2553.68 – 2483.24) and the monthly short-term trend at 2509.30.

It is important to note that weekly levels may be adjusted when the market opens.

This image is no longer relevant

H4 – H1

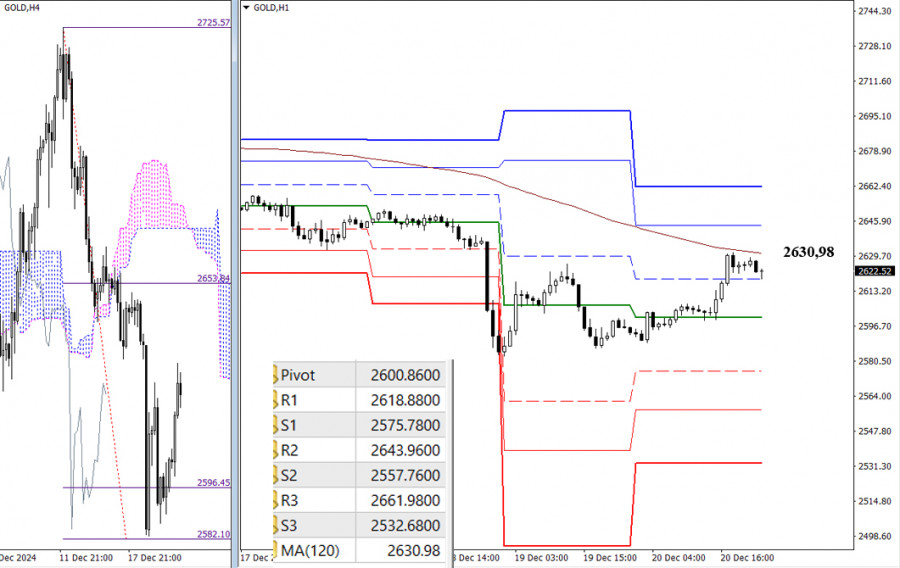
In the lower timeframes, bearish players fell short of achieving a 100% fulfillment of the target for breaking through the H4 Ichimoku cloud before the current corrective rise. Therefore, the H4 target can generally be considered fulfilled. Currently, the market is testing the most critical level on the lower timeframes: the weekly long-term trend at 2630.98. Control of this level will determine market sentiment, so working above 2630.98 will support the trend to bearish players, and a rebound and further decline would reinforce bearish sentiment. Key intraday targets will be determined by classic Pivot Points, with updated levels and positioning available, which you will need to focus on once trading begins.

***

Technical Analysis Components:
  • Higher Timeframes: Ichimoku Kinko Hyo (9.26.52) + Fibonacci Kijun levels
  • H1: Classic Pivot Points + Moving Average 120 (weekly long-term trend)

Recommended Stories

স্বর্ণের (XAU/USD) ট্রেডিং সিগন্যাল, ২৩–২৬ জুলাই, ২০২৫: স্বর্ণের মূল্য $3,437 (21 SMA - 8/8 মারে)-এর নিচে থাকা অবস্থায় এটি বিক্রি করুন

তবে যদি স্বর্ণের মূল্য 3,437-এর ওপরে কনসোলিডেট করে, তাহলে স্বর্ণের মূল্যের বুলিশ প্রবণতার সম্ভাবনা তৈরি হবে। এ অবস্থায়, মূল্য প্রথমে +1/8 মারে (3,472)-তে পৌঁছাতে পারে এবং এমনকি $3,500-এর সাইকোলজিক্যাল রেজিস্ট্যান্স

Dimitrios Zappas 08:52 2025-07-23 UTC+2

স্বর্ণের (XAU/USD) ট্রেডিং সিগন্যাল, ২২-২৫ জুলাই, ২০২৫: স্বর্ণের মূল্য $3,380 এর উপরে থাকা অবস্থায় কিনুন এবং $3,370 এর (200 EMA - 7/8 মারে) নিচে থাকা অবস্থায় বিক্রি করুন

ঈগল ইন্ডিকেটর ওভারবট জোনে পৌঁছেছে, তাই আমরা মনে করি স্বর্ণের মূল্য আসন্ন দিনগুলোতে একটি শক্তিশালী টেকনিক্যাল কারেকশনের মধ্য দিয়ে যেতে পারে। বিশেষ করে যদি মূল্য 6/8 মাড়ে লেভেলের নিচে নেমে

Dimitrios Zappas 08:35 2025-07-22 UTC+2

বিটকয়েনের ট্রেডিং সিগন্যাল, ২২-২৫ জুলাই, ২০২৫: মূল্য $115,625-এর (/8 মারে - 21 SMA) এর উপরে থাকা অবস্থায় বিটকয়েন কিনুন

বিটকয়েন বর্তমানে প্রায় $117,522 এর আশেপাশে ট্রেড করছে, এটির মূল্য $116,070 এর নিচে থেকে পুনরুদ্ধার করেছে। গতকাল ইউরোপীয় সেশনে বিটকয়েনের মূল্য $119,500-এর উচ্চতায় পৌঁছেছিল, তবে $120,000 এর সাইকোলজিক্যাল লেভেলের উপরে

Dimitrios Zappas 08:19 2025-07-22 UTC+2

বিটকয়েনের ট্রেডিং সিগন্যাল, ১৮-২১ জুলাই, ২০২৫: মূল্য $118,000 (6/8 মারে - 21 SMA) এর উপরে থাকা অবস্থায় বিটকয়েন ক্রয় করুন

যদি 118,750-এর সাপোর্ট বা 118,200 এর কাছাকাছি সেকেন্ডারি আপট্রেন্ড চ্যানেলের দিকে বিটকয়েনের মূল্যের টেকনিক্যাল কারেকশন হয়, তাহলে এটিকে বিটকয়েন ক্রয়ের সুযোগ হিসেবে বিবেচনা করা হবে, যেখানে এটির মূল্যের $121,500-এর দিকে

Dimitrios Zappas 09:45 2025-07-18 UTC+2

স্বর্ণের (XAU/USD) ট্রেডিং সিগন্যাল, ১৮-২১ জুলাই, ২০২৫: মূল্য $3,330 (21 SMA - 5/8 মারে) এর উপরে থাকা অবস্থায় স্বর্ণ ক্রয় করুন

অন্যদিকে, যদি স্বর্ণের মূল্য 3,320-এর নিচে নেমে যায় এবং আপট্রেন্ড চ্যানেল ব্রেক করে নিম্নমুখী হয়, তাহলে আমরা একটি ট্রেন্ড রিভার্সালের প্রত্যাশা করতে পারি এবং তখন এটির মূল্য 4/8 মারে লাইনে

Dimitrios Zappas 08:28 2025-07-18 UTC+2

স্বর্ণের (XAU/USD) ট্রেডিং সিগন্যাল (১৭-২১ জুলাই, ২০২৫): মূল্য $3,329 (200 EMA - 5/8 মারে) এর উপরে থাকা অবস্থায় স্বর্ণ ক্রয় করা যেতে পারে

স্বর্ণ বর্তমানে 3,335 এর আশেপাশে ট্রেড করছে, যেখানে 3,320 এর সর্বনিম্ন এবং গতকাল মার্কিন সেশনে 3,377 এর সর্বোচ্চ লেভেল থেকে রিবাউন্ড করছে। মার্কিন প্রেসিডেন্ট ডোনাল্ড ট্রাম্প পাওয়েলকে বরখাস্ত করার ইঙ্গিত

Dimitrios Zappas 08:28 2025-07-17 UTC+2

বিটকয়েনের ট্রেডিং সিগন্যাল, ১৭-২১ জুলাই, ২০২৫: মূল্য 118,750-এর উপরে (200 EMA - 6/8 মারে) থাকা অবস্থায় বিটকয়েন ক্রয় করা যেতে পারে

যদি বিটকয়েনের মূল্য $115.625-এর (5/8 মারে লেভেল) নিচে নামে, যা ১৪ জুলাইয়ের সর্বনিম্ন লেভেল ছিল, তাহলে এটির মূল্য 200 EMA-এর দিকে যেতে পারে, যা $110,000-এর সাইকোলজিক্যাল লেভেলের কাছাকাছি অবস্থান করছে।

Dimitrios Zappas 08:19 2025-07-17 UTC+2

স্বর্ণের (XAU/USD) ট্রেডিং সিগন্যাল, ১৭–২০, ২০২৫ জুলাই: মূল্য $3,300 (21 SMA - 5/8 মারে) এর উপরে থাকা অবস্থায় স্বর্ণ ক্রয় করুন

ঈগল ইন্ডিকেটর একটি পজিটিভ সিগন্যাল দেখাচ্ছে। তবে, স্বর্ণের মূল্যের বিয়ারিশ চাপও বিদ্যমান, তাই আমাদের সতর্ক থাকতে হবে, কারণ আগামী দিনগুলোতে স্বর্ণের দরপতন অব্যাহত থাকতে পারে। টেকনিক্যাল রিবাউন্ডের সম্ভাবনাও রয়েছে, কারণ

Dimitrios Zappas 08:47 2025-07-16 UTC+2

GBP/USD. বিশ্লেষণ ও পূর্বাভাস

আজ GBP/USD পেয়ার 1.3430–1.3435 লেভেলের মধ্যে কনসোলিডেশনের মধ্যে রয়েছে, যেখানে এই পেয়ারের মূল্য এশিয়ান ট্রেডিং সেশনের সময় রেকর্ডকৃত তিন সপ্তাহের মধ্যে সর্বনিম্ন লেভেলের তুলনায় সামান্য ওপরে অবস্থান করছে। এই মূহূর্তে

Irina Yanina 12:22 2025-07-15 UTC+2

GBP/JPY। বিশ্লেষণ, পূর্বাভাস এবং বর্তমান বাজার পরিস্থিতি

বৃহস্পতিবার GBP/JPY পেয়ারের মূল্য আবারও ঊর্ধ্বমুখী হয়েছে এবং আরও দর বৃদ্ধির প্রস্তুতি নিচ্ছে বলে মনে হচ্ছে। একটি অ্যাসেন্ডিং চ্যানেলের গঠন বুলিশ প্রবণতার স্থিতিশীলতা নিশ্চিত করছে। এশিয়ান সেশনে, মূল্য 198.40–198.35 লেভেলের

Irina Yanina 10:29 2025-07-10 UTC+2
এখন কথা বলতে পারবেন না?
আপনার প্রশ্ন জিজ্ঞাসা করুন চ্যাট.
 

Dear visitor,

Your IP address shows that you are currently located in the USA. If you are a resident of the United States, you are prohibited from using the services of InstaFintech Group including online trading, online transfers, deposit/withdrawal of funds, etc.

If you think you are seeing this message by mistake and your location is not the US, kindly proceed to the website. Otherwise, you must leave the website in order to comply with government restrictions.

Why does your IP address show your location as the USA?

  • - you are using a VPN provided by a hosting company based in the United States;
  • - your IP does not have proper WHOIS records;
  • - an error occurred in the WHOIS geolocation database.

Please confirm whether you are a US resident or not by clicking the relevant button below. If you choose the wrong option, being a US resident, you will not be able to open an account with InstaTrade anyway.

We are sorry for any inconvenience caused by this message.