Прямоугольник
сформирован 02.06 в 19:05:14 (UTC+0)
сила сигнала 1 из 5

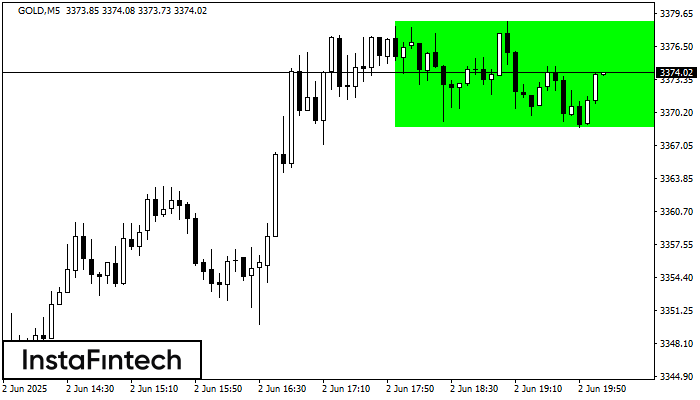
По GOLD на M5 сформировалась фигура «Прямоугольник». Фигура данного типа относится к тому типу продолжения тренда, который содержит в себе два уровня: Сопротивление 3378.88; Поддержка 3368.80. В случае пробоя уровня сопротивления 3378.88 возможно дальнейшее восходящее движение.
Таймфреймы М5 и М15 могут иметь больше ложных точек входа.
- Все
- Все
- Bearish Rectangle
- Bearish Symmetrical Triangle
- Bullish Rectangle
- Double Top
- Double Top
- Triple Bottom
- Triple Bottom
- Triple Top
- Triple Top
- Все
- Все
- Покупка
- Продажа
- Все
- 1
- 2
- 3
- 4
- 5
Double Bottom
was formed on 04.07 at 15:45:19 (UTC+0)
signal strength 2 of 5
The Double Bottom pattern has been formed on NZDJPY M15. This formation signals a reversal of the trend from downwards to upwards. The signal is that a buy trade should
The M5 and M15 time frames may have more false entry points.
Open chart in a new window
Double Bottom
was formed on 04.07 at 15:29:40 (UTC+0)
signal strength 2 of 5
The Double Bottom pattern has been formed on AUDJPY M15. Characteristics: the support level 94.53; the resistance level 94.65; the width of the pattern 12 points. If the resistance level
The M5 and M15 time frames may have more false entry points.
Open chart in a new window
Bullish Symmetrical Triangle
was formed on 04.07 at 14:53:15 (UTC+0)
signal strength 1 of 5
According to the chart of M5, NZDCAD formed the Bullish Symmetrical Triangle pattern. The lower border of the pattern touches the coordinates 0.8227/0.8235 whereas the upper border goes across 0.8246/0.8235
The M5 and M15 time frames may have more false entry points.
Open chart in a new window