Bullish Rectangle
was formed on 02.06 at 19:05:14 (UTC+0)
signal strength 1 of 5
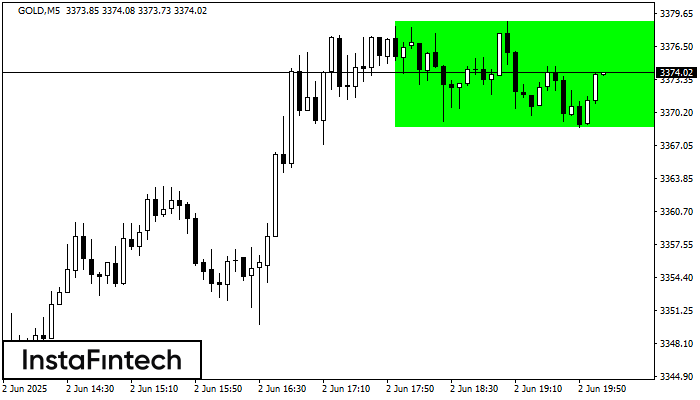
According to the chart of M5, GOLD formed the Bullish Rectangle. This type of a pattern indicates a trend continuation. It consists of two levels: resistance 3378.88 and support 3368.80. In case the resistance level 3378.88 - 3378.88 is broken, the instrument is likely to follow the bullish trend.
The M5 and M15 time frames may have more false entry points.
আরও দেখুন
- All
- All
- Bearish Rectangle
- Bearish Symmetrical Triangle
- Bullish Rectangle
- Double Top
- Double Top
- Triple Bottom
- Triple Bottom
- Triple Top
- Triple Top
- All
- All
- Buy
- Sale
- All
- 1
- 2
- 3
- 4
- 5
বুলিশ রেক্ট্যাঙ্গেল
was formed on 04.07 at 22:12:11 (UTC+0)
signal strength 3 of 5
M30 চার্ট অনুসারে, EURCAD বুলিশ রেক্ট্যাঙ্গেল গঠন করেছে যা চলমান প্রবণতার ধারাবাহিকতার প্যাটার্ন। প্যাটার্নটি নিম্নলিখিত সীমানার মধ্যে রয়েছে: নীচের সীমানা 1.6017 – 1.6017 এবং উপরের সীমানা 1.6038 – 1.6038৷ উপরের
Open chart in a new window
বুলিশ রেক্ট্যাঙ্গেল
was formed on 04.07 at 22:07:30 (UTC+0)
signal strength 2 of 5
M15 চার্ট অনুসারে, EURCAD বুলিশ রেক্ট্যাঙ্গেল গঠন করেছে যা চলমান প্রবণতার ধারাবাহিকতার প্যাটার্ন। প্যাটার্নটি নিম্নলিখিত সীমানার মধ্যে রয়েছে: নীচের সীমানা 1.6017 – 1.6017 এবং উপরের সীমানা 1.6038 – 1.6038৷ উপরের
M5 এবং M15 টাইম ফ্রেমে আরও ভুল এন্ট্রি পয়েন্ট থাকতে পারে।
Open chart in a new window
হেড অ্যান্ড শোল্ডার্স
was formed on 04.07 at 21:05:54 (UTC+0)
signal strength 1 of 5
M5 চার্ট অনুযায়ী, EURNZD-এর হেড অ্যান্ড শোল্ডার্স প্যাটার্ন গঠিত হয়েছে। হেডের টপ 1.9461-এ নির্ধারণ করা হয়েছে এবং নেকের মিডিয়ান লাইনটি 1.9436/1.9439-এ পাওয়া যায়। হেড অ্যান্ড শোল্ডার্স প্যাটার্নের গঠন স্পষ্টতই ঊর্ধ্বমুখী
M5 এবং M15 টাইম ফ্রেমে আরও ভুল এন্ট্রি পয়েন্ট থাকতে পারে।
Open chart in a new window