
यह भी देखें


 15.07.2026 10:02 AM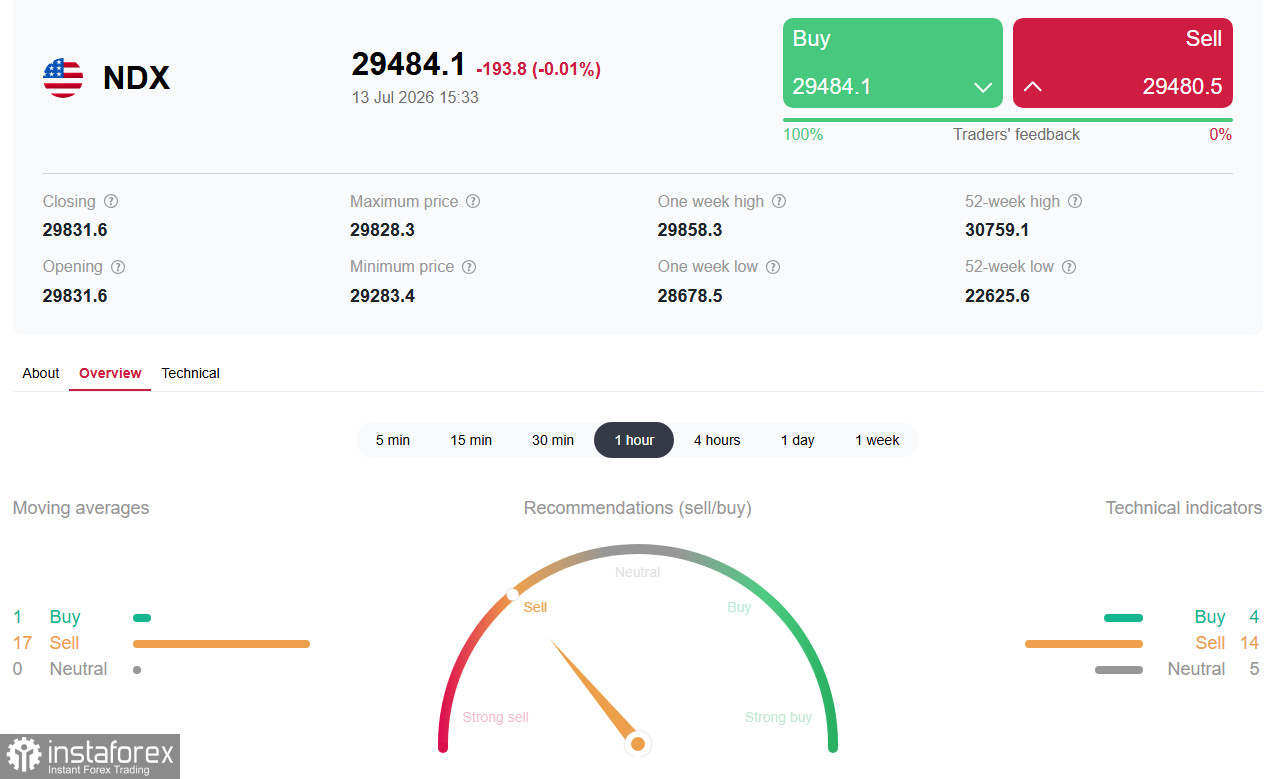
The Nasdaq-100 tech index enters the new week under pressure, consolidating after a failed attempt to hold above the 30,000 resistance. Futures on the index (NDX in trading terminals) were down about 0.8% on Monday amid renewed geopolitical tensions in the Middle East and a correction in the semiconductor sector. The market is trapped between bullish hopes for strong corporate earnings and bearish risks tied to rising oil prices, tighter Fed policy and a possible slowdown in AI investment.
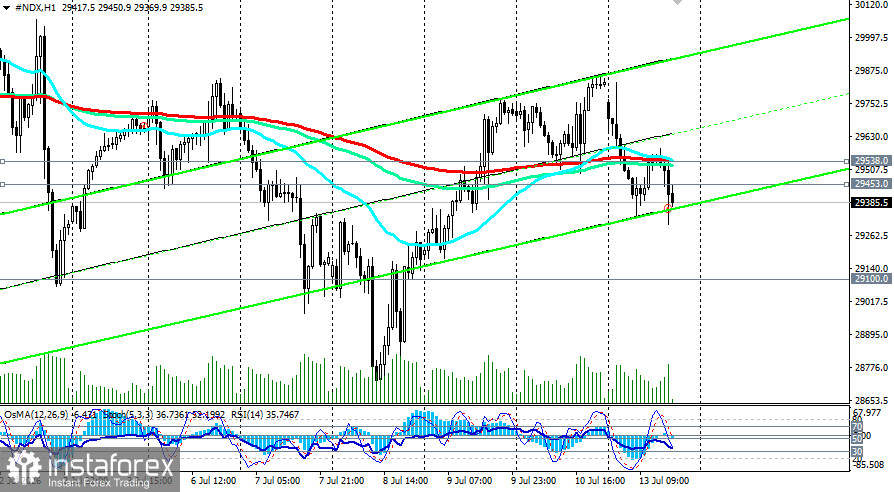
Early in the week, the Nasdaq-100 is under pressure, pulling back from the 29,850–29,900 resistance zone and testing key short?term support break levels at 29,538 and 29,453 (the 200?EMA on the 1- and 4-hour charts).
The primary driver was the resumption of hostilities between the US and Iran and the closure of the Strait of Hormuz, which pushed oil prices higher and renewed inflation concerns.
Additional pressure on the tech sector comes from a pullback in chipmakers' shares. SK Hynix — whose American depositary receipts (ADRs) debuted on Friday — has plunged, weighing on the Philadelphia Semiconductor Index (SOX). This is happening amid lingering worries about the sustainability of AI?chip demand and a sector overheating following a powerful rally.
Fundamental backdrop: three main risks and one key catalyst
Economists highlight three main risks that could derail the US summer stock rally:
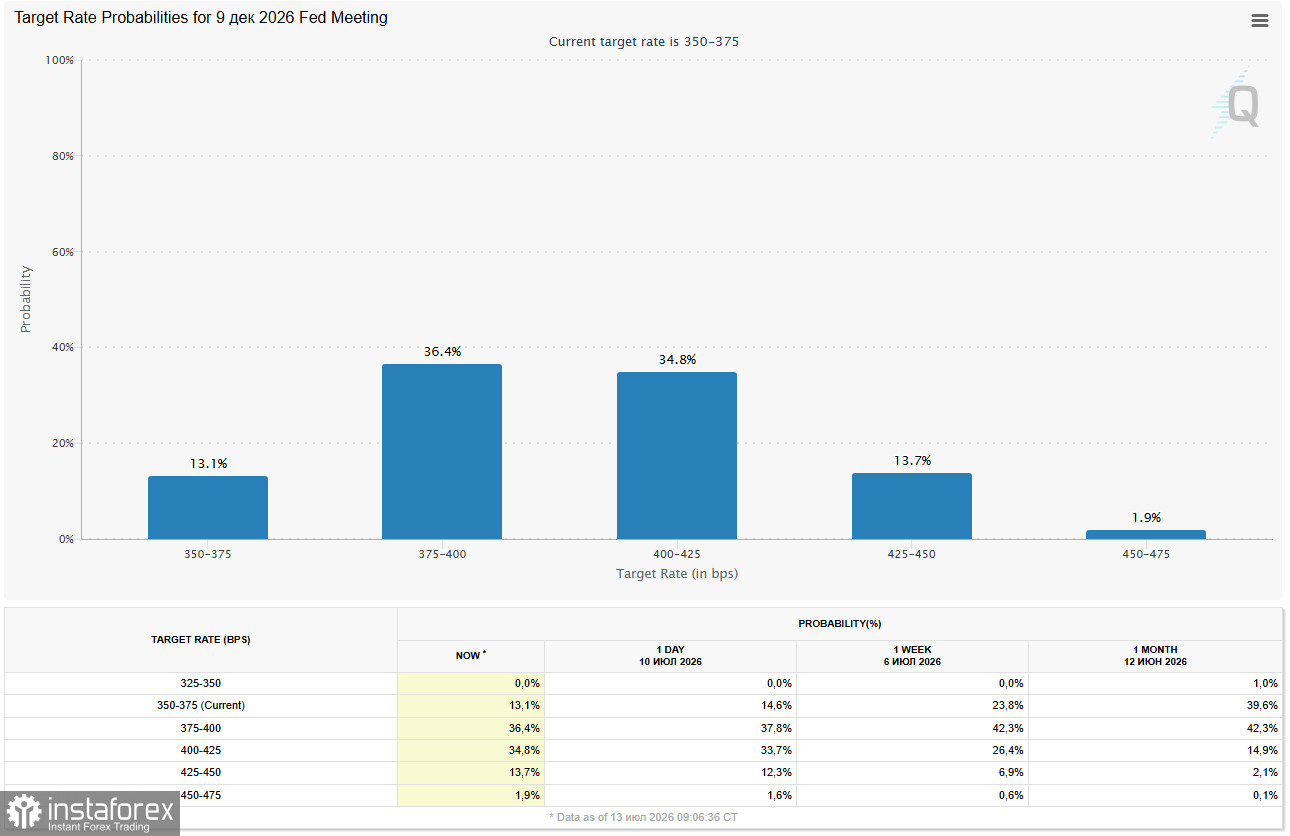
Key catalyst: CPI data and Warsh's testimony
This week, the decisive event will be the release of June consumer price index (CPI) data on Tuesday, July 14, at 8:30 a.m. ET (12:30 GMT). The consensus forecast calls for headline CPI to fall to 3.8% year-on-year from 4.2% in May.
This release could determine Nasdaq?100's direction:
On the same day, Fed Chair Kevin Warsh will deliver his semiannual monetary policy testimony to Congress for the first time. His assessment of inflation risks and policy direction will be an important market signal.
Brief technical analysis
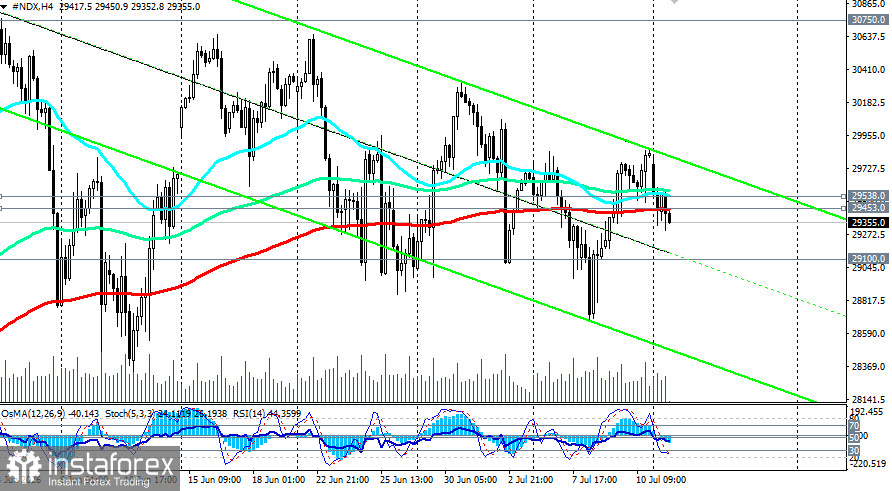
Technically, the Nasdaq-100 retains a short-term bearish bias, consolidating below key resistance levels. The index has broken important short-term supports at 29,538 and 29,453 (200-EMA on the 1- and 4-hour charts) and is moving toward the lower boundary of the daily up-channel near 28,900.
The 14?day RSI on the daily chart sits around 48–49, below the neutral 50 level, confirming weakening bullish momentum.
A declining OsMA histogram in negative territory points to a fading bullish impulse and a growing probability of a correction.
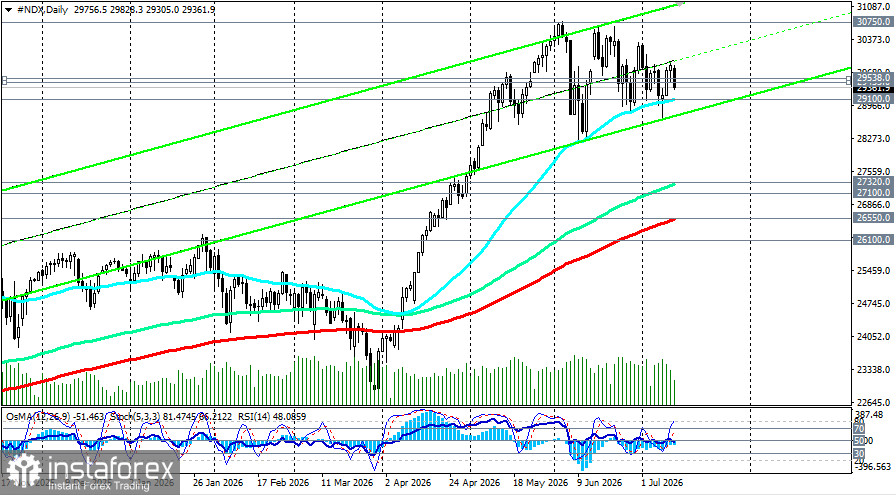
Key levels
Recommendations for investors this week

