empty
10.06.2022 11:14 AM
Analysis of EUR/GBP on June 10, 2022

Hi everyone!

Traditionally, I make an analysis of the euro/pound par on Friday. In today's two previous articles on the euro/dollar and pound/dollar pairs, I analyzed the results of yesterday's ECB meeting, the market reaction, and the main risks for the UK economy. For this reason, in this article, I will focus mainly on the technical analysis of EUR/GBP. Let's look at the weekly chart.

Weekly

This image is no longer relevant

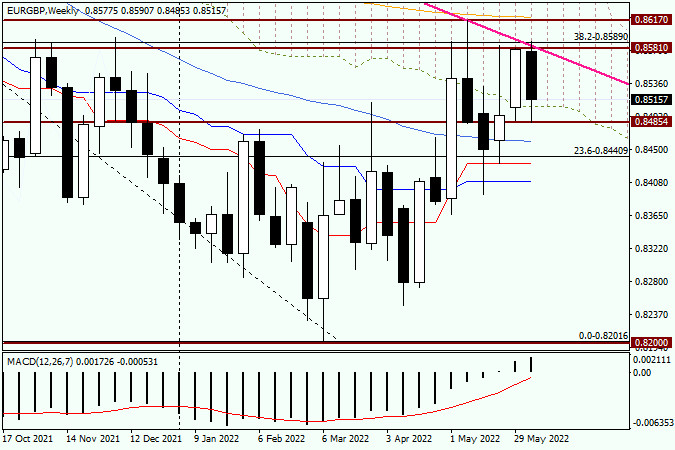
Despite the fact that the euro/pound finished last week near the Ichimoku Cloud, the bears were not ready to give up. As seen on the chart, the pair has been trading in a bearish channel during this week. Sellers have even tried to push the price below the Ichimoku Cloud. Thus, they will do everything possible to end the week near the cloud. Some sellers will try to complete the week near the indicator, while others, on the contrary, will try to push the price down. Judging by technical indicators, there is a strong resistance area of 0.8581-0.8617. At the first level, the highest level of last week was located. The bulls' attempts to break through the resistance level of 0.8581 only led to a false breakout.

The support level indicates last week's lows as trading was carried out at 0.8487. The attempts of bears to push the pair below this level were also unsuccessful. Given the technical outlook on the weekly chart, the bullish trend is possible only after a breakout of the resistance level of 0.8617 and the 200 exponential moving average, which is located at this level. Bears have a more difficult task. They need to push the price to all previously passed indicators: 50 moving average, the Tenkan, and Kijun lines. Currently, the pair is n the correction phase. After a decline to 0.9216-0.8201, the pair retreated to the Fibonacci level of 38.2 which shows a bearish trend. Thus, the EUR/GBP pair is in a downtrend channel. It is also confirmed by the pink resistance line. Attempts to break through this line were also unsuccessful.

Daily

This image is no longer relevant

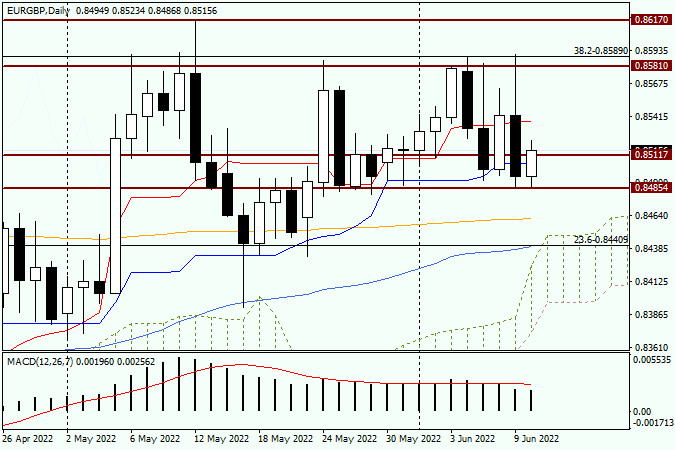
Yesterday's daily candlestick is very similar to the one that was formed for the EUR/GBP pair. After a rise to 0.8590, there was a sharp downward reversal to 0.8485. Apparently, this is a strong technical level as it has stopped yesterday's fall but also facilitated today's growth. If the euro/pound pair continues to rise, it will face resistance near the Tenkan red line, which runs at 0.8538. The pair is trading near 0.8517. Bulls and bears are likely to tussle for the closing price of the day and week near the psychologically important level of 0.8500. Given trader's disappointment with the ECB's rhetoric, as well as yesterday's bearish candlestick with a long upper shadow, the likelihood of a decline is high. It is better to wait for the convergence with the Tenkan line. After that, I would advise you to monitor bearish candlestick patterns on the weekly or smaller charts. If they appear, it will be a sell signal.

Have a wonderful weekend!

Recommended Stories

The cable sedang berusaha untuk menguji dan menembus support 1,3316, Selasa 29 Juli 2025.

GBP/USD – Selasa, 29 Juli 2025. Kondisi Death Cross EMA (50) yang berada di bawah EMA (200) serta RSI (14) yang berada di kondisi netral b earish memberi petunjuk bahwa

Arief Makmur 06:50 2025-07-29 UTC+2

148,91 saat ini menjadi target utama untuk diuji oleh USD/JPY dalam waktu dekat ini, Selasa 29 Juli 2025.

USD/JPY – Selasa, 29 Juli 2025. Berdasarkan posisi Golden Cross pada EMA (50) dan EMA (200) memberi petunjuk kalau bias penguatan dominan di USD/JPY namun dengan kondisi RSI(14) berada

Arief Makmur 06:47 2025-07-29 UTC+2

Prediksi EUR/USD untuk 29 Juli 2025

Setelah penurunan lebih dari 160 pips kemarin akibat kesepakatan perdagangan yang sangat tidak menguntungkan antara EU dan AS, peluang euro untuk naik menuju batas atas saluran hijau hampir mendekati

Laurie Bailey 05:02 2025-07-29 UTC+2

Prediksi GBP/USD untuk 29 Juli 2025

Menjelang akhir kemarin, pound Inggris turun sebanyak 82 pip, menembus target support di 1,3369. Sesi hari ini dibuka di bawah level ini, dan penutupan harian di bawahnya akan mengonfirmasi bahwa

Laurie Bailey 05:02 2025-07-29 UTC+2

Prediksi USD/JPY untuk 29 Juli 2025

Pada pasangan USD/JPY, pergerakan naik terus berlanjut menuju level target 149,38, yang ditandai oleh celah yang belum tertutup sejak 21 Juli. Breakout resistance ini akan membuka jalan menuju target berikutnya

Laurie Bailey 05:02 2025-07-29 UTC+2

GBP/USD. Analisis Teknikal untuk Minggu 28 Juli – 2 Agustus

Minggu lalu, pasangan ini bergerak naik dan menguji level resistance historis di 1,3591 (garis putus-putus biru), kemudian berbalik arah dan menutup candle mingguan di 1,3435. Pada minggu mendatang, harga mungkin

Stefan Doll 19:16 2025-07-28 UTC+2

EUR/USD. Analisis Teknis untuk Minggu 28 Juli – 2 Agustus

Minggu lalu, pasangan ini bergerak naik dan menguji fraktal atas di 1.1790 (candle mingguan dari 6 Juli 2025), setelah itu harga berbalik turun, menutup candle mingguan di 1.1742. Pada minggu

Stefan Doll 19:12 2025-07-28 UTC+2

EUR/USD. Analisis dan Prediksi

Pada awal pekan baru selama sesi Asia, pasangan EUR/USD mencoba untuk tetap positif, tetapi selama sesi Eropa, harga jatuh di bawah level 1.1750 di tengah ekspektasi data makroekonomi utama

Irina Yanina 11:13 2025-07-28 UTC+2

EUR/USD – 28 Juli: Uni Eropa dan AS Mencapai Kesepakatan

Pada hari Jumat, pasangan EUR/USD kembali ke level retracement 127,2% di 1,1712 dan memantul dari level tersebut. Ini menunjukkan bahwa pergerakan naik mungkin berlanjut menuju level berikutnya di 1,1802. Pergerakan

Samir Klishi 10:58 2025-07-28 UTC+2

GBP/USD – 28 Juli: AS dan China Mencapai Kesepakatan Juga

Pada grafik per jam, pasangan GBP/USD melanjutkan penurunannya pada hari Jumat menuju level 1.3425 setelah ditutup di bawah level retracement 76.4% di 1.3470. Hari ini, pergerakan tegas di bawah 1.3425

Samir Klishi 10:40 2025-07-28 UTC+2
Tidak bisa bicara sekarang?
Tanyakan pertanyaan anda lewat chat.
 

Dear visitor,

Your IP address shows that you are currently located in the USA. If you are a resident of the United States, you are prohibited from using the services of InstaFintech Group including online trading, online transfers, deposit/withdrawal of funds, etc.

If you think you are seeing this message by mistake and your location is not the US, kindly proceed to the website. Otherwise, you must leave the website in order to comply with government restrictions.

Why does your IP address show your location as the USA?

  • - you are using a VPN provided by a hosting company based in the United States;
  • - your IP does not have proper WHOIS records;
  • - an error occurred in the WHOIS geolocation database.

Please confirm whether you are a US resident or not by clicking the relevant button below. If you choose the wrong option, being a US resident, you will not be able to open an account with InstaTrade anyway.

We are sorry for any inconvenience caused by this message.