empty
10.06.2022 11:14 AM
Analysis of EUR/GBP on June 10, 2022

Hi everyone!

Traditionally, I make an analysis of the euro/pound par on Friday. In today's two previous articles on the euro/dollar and pound/dollar pairs, I analyzed the results of yesterday's ECB meeting, the market reaction, and the main risks for the UK economy. For this reason, in this article, I will focus mainly on the technical analysis of EUR/GBP. Let's look at the weekly chart.

Weekly

This image is no longer relevant

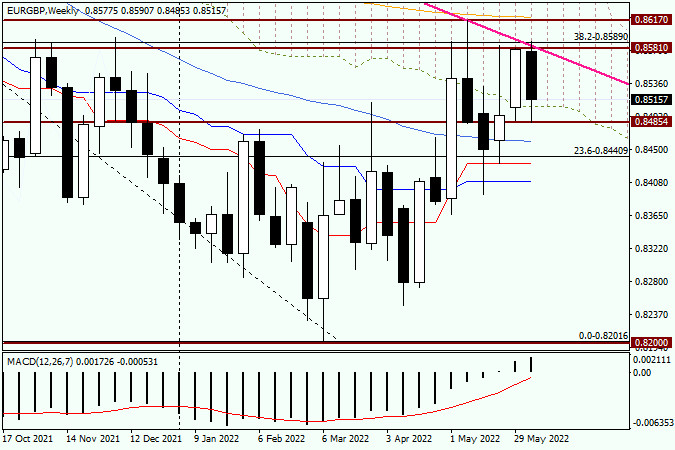
Despite the fact that the euro/pound finished last week near the Ichimoku Cloud, the bears were not ready to give up. As seen on the chart, the pair has been trading in a bearish channel during this week. Sellers have even tried to push the price below the Ichimoku Cloud. Thus, they will do everything possible to end the week near the cloud. Some sellers will try to complete the week near the indicator, while others, on the contrary, will try to push the price down. Judging by technical indicators, there is a strong resistance area of 0.8581-0.8617. At the first level, the highest level of last week was located. The bulls' attempts to break through the resistance level of 0.8581 only led to a false breakout.

The support level indicates last week's lows as trading was carried out at 0.8487. The attempts of bears to push the pair below this level were also unsuccessful. Given the technical outlook on the weekly chart, the bullish trend is possible only after a breakout of the resistance level of 0.8617 and the 200 exponential moving average, which is located at this level. Bears have a more difficult task. They need to push the price to all previously passed indicators: 50 moving average, the Tenkan, and Kijun lines. Currently, the pair is n the correction phase. After a decline to 0.9216-0.8201, the pair retreated to the Fibonacci level of 38.2 which shows a bearish trend. Thus, the EUR/GBP pair is in a downtrend channel. It is also confirmed by the pink resistance line. Attempts to break through this line were also unsuccessful.

Daily

This image is no longer relevant

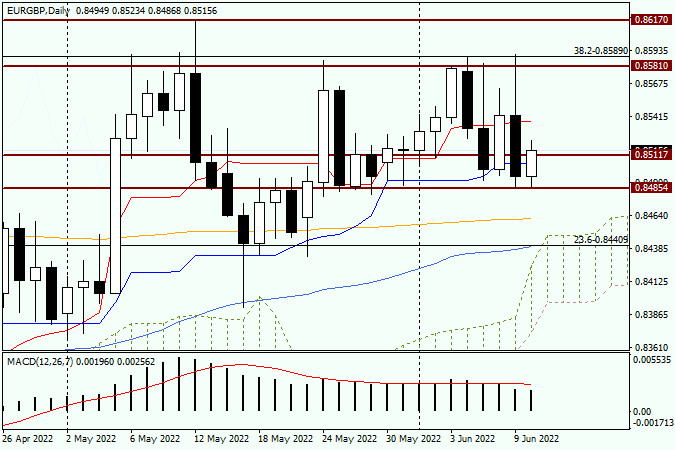
Yesterday's daily candlestick is very similar to the one that was formed for the EUR/GBP pair. After a rise to 0.8590, there was a sharp downward reversal to 0.8485. Apparently, this is a strong technical level as it has stopped yesterday's fall but also facilitated today's growth. If the euro/pound pair continues to rise, it will face resistance near the Tenkan red line, which runs at 0.8538. The pair is trading near 0.8517. Bulls and bears are likely to tussle for the closing price of the day and week near the psychologically important level of 0.8500. Given trader's disappointment with the ECB's rhetoric, as well as yesterday's bearish candlestick with a long upper shadow, the likelihood of a decline is high. It is better to wait for the convergence with the Tenkan line. After that, I would advise you to monitor bearish candlestick patterns on the weekly or smaller charts. If they appear, it will be a sell signal.

Have a wonderful weekend!


Recommended Stories

การคาดการณ์คู่สกุลเงิน EUR/USD สำหรับวันที่ 10 กรกฎาคม 2025

เมื่อวันพุธ คู่เงิน EUR/USD ยังคงเคลื่อนตัวไปในแนวทางที่มีเพียงตนเองรู้ ระดับการปรับตัว 127.2% ของ Fibonacci ที่ 1.1712 ถูกเพิกเฉยจากนักเทรดอีกครั้ง ฉันยังคงไม่แนะนำให้ใช้เป็นตัวอ้างอิงสำหรับสัญญาณการซื้อขาย—ยกเว้นอาจจะเป็นสัญญาณซื้อ เนื่องจากพื้นหลังของข่าวปัจจุบันยังคงสนับสนุนการเติบโตของเงินยูโร ในช่วงไม่กี่สัปดาห์ที่ผ่านมา ฝ่ายขายยังไม่สามารถแสดงความแข็งแกร่งที่แท้จริงออกมาได้

Samir Klishi 12:21 2025-07-10 UTC+2

การพยากรณ์สำหรับ GBP/USD ในวันที่ 10 กรกฎาคม 2025

บนกราฟหนึ่งชั่วโมงในวันพุธ คู่เงิน GBP/USD ยังคงเคลื่อนไหวในทิศทางขาขึ้นต่อเนื่องหลังจากดีดตัวจากระดับการปรับค่า Fibonacci ที่ 127.2% ที่ 1.3527 การดีดตัวนี้เกิดขึ้นอย่างแม่นยำ นำไปสู่การกลับตัวที่เป็นบวกต่อเงินปอนด์อังกฤษและกลับไปที่ระดับแนวต้านที่ 1.3611–1.3633 ฉันมั่นใจพอสมควรว่าระดับนี้จะถูกทะลุในอนาคตอันใกล้—อาจจะแม้แต่วันนี้ ภูมิหลังของข้อมูลในสัปดาห์นี้ทำให้ดอลลาร์สหรัฐรักษาแรงดึงตัวที่เพิ่มขึ้นล่าสุดได้ยาก การปิดเหนือระดับ

Samir Klishi 10:35 2025-07-10 UTC+2

GBP/JPY: การวิเคราะห์ การคาดการณ์ และสถานการณ์ตลาดปัจจุบัน

เมื่อวันพฤหัสบดี คู่สกุลเงิน GBP/JPY ได้รับแรงหนุนให้กลับมาสู่แนวโน้มขาขึ้นอีกครั้งและแสดงสัญญาณความพร้อมสำหรับการขยายตัวต่อไป การก่อตัวของช่องทางขาขึ้นยืนยันถึงความมั่นคงของแนวโน้มขาขึ้นนี้ ในช่วงการซื้อขายเอเชีย ผู้ซื้อมีความกระตือรือร้นมากขึ้นใกล้ระดับ 198.40–198.35 ซึ่งช่วยจำกัดการปรับตัวลดลงจากระดับสูงสุดของปีที่เคยถึงในช่วงก่อนหน้า คู่สกุลเงินนี้ปัจจุบันเคลื่อนที่อยู่รอบระดับจิตวิทยาที่ 199.00 และยังคงมีแนวโน้มขาขึ้น ในช่วงสองเดือนที่ผ่านมา คู่สกุลเงินนี้เคลื่อนที่ภายในช่องทางขาขึ้นซึ่งบ่งบอกถึงการเติบโตอย่างต่อเนื่อง ตัววัดสัญญาณออสซิลเลเตอร์ในกราฟรายวันยังคงอยู่ในดินแดนบวกและยังไม่เข้าสู่สภาวะที่ซื้อมากเกินไป

Irina Yanina 10:22 2025-07-10 UTC+2

หากแนวต้านที่ระดับ 0.7964 สามารถหยุดยั้งการเคลื่อนไหวขึ้นได้ USD/CHF มีแนวโน้มที่จะอ่อนตัวลงในวันพฤหัสบดีที่ 10 กรกฎาคม 2025

USD/CHF, วันพฤหัสบดีที่ 10 กรกฎาคม 2025 นอกจากข่าวลือเกี่ยวกับการตัดสินใจลดอัตราดอกเบี้ยของ Fed และการลดลงของอัตราดอกเบี้ยพันธบัตรรัฐบาลสหรัฐ USD/CHF ลดลงในวันนี้ ระดับที่สำคัญ 1. แนวต้าน 2: 0.7990

Arief Makmur 06:47 2025-07-10 UTC+2

ค่าเงินปอนด์อาจมีศักยภาพในการทดสอบระดับ Pivot และ Support 1 ได้ในอนาคตอันใกล้ในวันพฤหัสบดีที่ 10 กรกฎาคม 2025

GBP/USD, วันพฤหัสบดีที่ 10 กรกฎาคม 2025 ข่าวลือเกี่ยวกับนโยบายการเงินผ่อนคลายของ Fed ในอนาคตได้สร้างความรู้สึกเชิงลบต่อ USD ซึ่งอาจช่วยให้เงินปอนด์อังกฤษแข็งค่าอีกครั้งในวันนี้ ระดับสำคัญ 1. ระดับต้านทานที่ 2: 1.3642

Arief Makmur 06:47 2025-07-10 UTC+2

การคาดการณ์ EUR/USD สำหรับวันที่ 10 กรกฎาคม 2025

ตลาดยังคงทดสอบกลยุทธ์ความเสี่ยงที่สูงขึ้น เมื่อวานนี้ S&P 500 เพิ่มขึ้น 0.61% ราคาน้ำมันลดลง 0.22% และยูโรลดลงเพียง 4 จุด ซึ่งเมื่อพิจารณาจากความผันผวนในแต่ละวันที่ต่ำ สามารถถือว่าเป็นผลลัพธ์ที่เป็นกลาง หลังจากดีดตัวกลับจากระดับ 1.1692

Laurie Bailey 06:14 2025-07-10 UTC+2

สัญญาณการซื้อขายสำหรับทองคำ (XAU/USD) ระหว่างวันที่ 10-15 กรกฎาคม 2025: แนะนำขายหากต่ำกว่า $3,330 (21 SMA - 200 EMA)

ในช่วงต้นของการซื้อขายยุโรป ทองคำอยู่ที่ประมาณ 3,317 ซึ่งกลับมาเพิ่มขึ้นหลังจากที่ร่วงลงต่ำสุดที่ 3,281 ขณะนี้กำลังมุ่งสู่ระดับแนวต้าน ช่วง 3,330-3,360 ได้พิสูจน์แล้วว่าเป็นแนวต้านที่แข็งแกร่งสำหรับทองคำในอดีต ดังนั้นเราจึงเชื่อว่าหากต่ำกว่า 3,330 ทองคำควรต้องมีการปรับฐานทางเทคนิคและอาจไปถึงแนวรับที่ 3,281 และ 3,242

Dimitrios Zappas 06:10 2025-07-10 UTC+2

สัญญาณการซื้อขายสำหรับ EUR/USD ระหว่างวันที่ 10-15 กรกฎาคม 2025: ขายต่ำกว่า 1.1753 (200 EMA - +1/8 Murray)

ในช่วงต้นของเซสชันยุโรป ยูโรมีการซื้อขายอยู่ราว ๆ 1.1737 ซึ่งสูงกว่าค่าเฉลี่ยเคลื่อนที่ 21 วัน และกำลังพยายามที่จะทะลุแนวต้านของช่องแนวโน้มขาลงที่เกิดขึ้นตั้งแต่ปลายเดือนมิถุนายน หากแรงซื้อยังคงมีอยู่และยูโรสามารถยืนเหนือ 1.1753 ได้ เราอาจคาดหวังว่าอาจจะมีวัฏจักรขาขึ้นใหม่ และยูโรอาจไปถึงระดับ +1/8

Dimitrios Zappas 06:08 2025-07-10 UTC+2

การคาดการณ์ค่าเงิน GBP/USD สำหรับวันที่ 10 กรกฎาคม 2025

ค่าเงินปอนด์ของอังกฤษกำลังค่อยๆ เข้าใกล้แนวต้านเป้าหมายที่ 1.3635 หากสามารถทะลุผ่านระดับนี้ได้จะเปิดทางไปยังเส้น MACD ที่ 1.3705 เป้าหมายนี้มีแนวโน้มที่จะบรรลุผลสำเร็จได้ เนื่องจาก Marlin oscillator กำลังเพิ่มขึ้นนำหน้าราคาอยู่ในขณะนี้และจะเข้าสู่แดนบวกในไม่ช้า เมื่อถึงตอนนั้นมันจะให้แรงส่งเพิ่มเติมแก่ราคาเพื่อเอาชนะระดับ 1.3635 การพุ่งทะลุเหนือเส้น

Laurie Bailey 05:53 2025-07-10 UTC+2

การคาดการณ์ค่าเงิน AUD/USD สำหรับวันที่ 10 กรกฎาคม 2025

AUD/USDในแผนภูมิรายวัน ออสซิลเลเตอร์ Marlin ยังคงเคลื่อนไหวอย่างยืดเยื้อไปตามเส้นศูนย์ที่เป็นกลาง เมื่อราคาทะลวงผ่านระดับความต้านทานหรือการสนับสนุนใหม่ๆ ที่ระดับท้องถิ่น มันจะเจอกับอุปสรรคใหม่ ระดับสำคัญถัดไปคือตอนนี้เส้นขอบบนของช่องราคาที่บริเวณใกล้ 0.6596 การรวมตัวเหนือระดับนี้จะเปิดทางไปสู่เป้าหมายที่ 0.6650 ออสซิลเลเตอร์ Marlin ยังคงอยู่ในโซนบวกและกำลังเพิ่มขึ้น ซึ่งบ่งบอกว่าเส้นสีเขียวของช่องราคาน่าจะถูกทำลาย—โดยเฉพาะอย่างยิ่งเมื่อเส้น

Laurie Bailey 05:42 2025-07-10 UTC+2
หากไม่สะดวกคุยในตอนนี้
ระบุคำถามไว้ได้ใน แชท.
 

Dear visitor,

Your IP address shows that you are currently located in the USA. If you are a resident of the United States, you are prohibited from using the services of InstaFintech Group including online trading, online transfers, deposit/withdrawal of funds, etc.

If you think you are seeing this message by mistake and your location is not the US, kindly proceed to the website. Otherwise, you must leave the website in order to comply with government restrictions.

Why does your IP address show your location as the USA?

  • - you are using a VPN provided by a hosting company based in the United States;
  • - your IP does not have proper WHOIS records;
  • - an error occurred in the WHOIS geolocation database.

Please confirm whether you are a US resident or not by clicking the relevant button below. If you choose the wrong option, being a US resident, you will not be able to open an account with InstaTrade anyway.

We are sorry for any inconvenience caused by this message.