empty
29.10.2021 12:30 PM
Technical analysis recommendations of EUR/USD and GBP/USD on October 29

EUR/USD

This image is no longer relevant

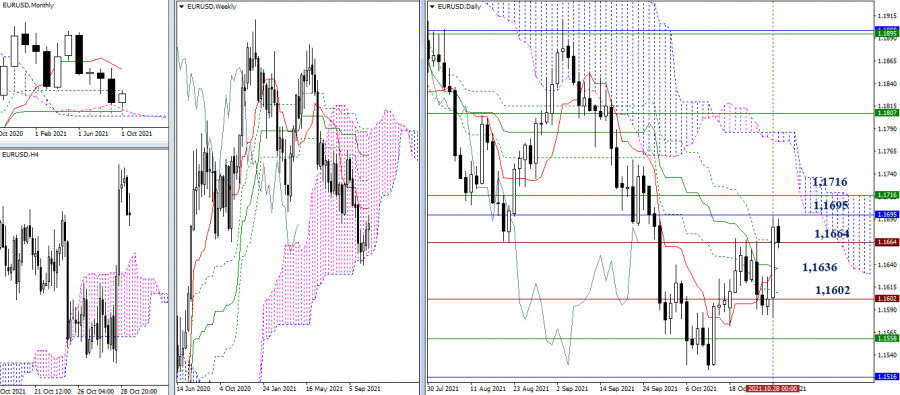
The end of the week and month is approaching. Yesterday, the bulls tried to break through the historical level of 1.1664. If the result can be consolidated in a weekly format, then the question of breaking through the resistance area of 1.1695 - 1.1716 (monthly Fibo Kijun + weekly Tenkan) will arise.

The failure to overcome the level of 1.1664, formation of a long upper shadow of the weekly candle and a return to the supports of 1.1636 (daily cross) or 1.1602 (historical level), will bring uncertainty back to the market.

This image is no longer relevant

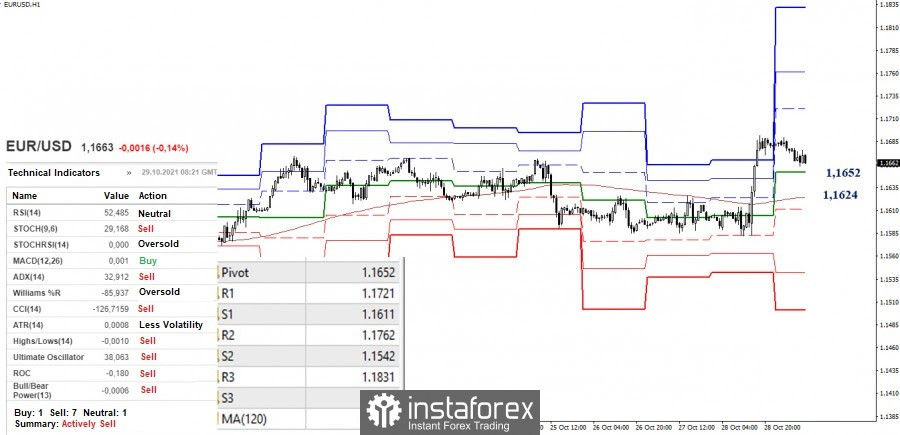
At the moment, there is a decline and test of the central pivot level (1.1652) in the smaller timeframes. The line of the weekly long-term trend (1.1624) is important for the bulls. In the case of consolidation below, the bears will regain their advantages. Their next pivot points will be the support of the classic pivot levels 1.1611 - 1.1542 - 1.1501. But if a rebound from the encountered support levels occurs in the near future and the high (1.1692) is updated, then bullish prospects will be represented by the resistances of the classic pivot levels 1.1721 - 1.1762 - 1.1831.

GBP/USD

This image is no longer relevant

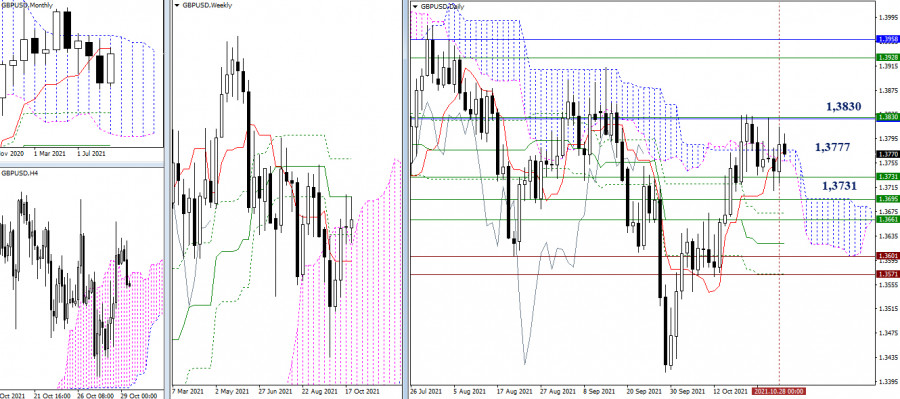
The situation could not be changed dramatically despite yesterday's bullish activity. The pair remained within the borders of 1.3830 (monthly short-term trend + weekly medium-term trend) and 1.3731 (weekly Fibo Kijun). In this case, the center of attraction is still the daily cloud (1.3777). Therefore, the possible prospects remained unchanged.

The breakdown of the support at 1.3731 will open the way to the next levels of 1.3695 (upper border of the weekly cloud) and 1.3661 (weekly short-term trend). The breakdown of the resistance at 1.3830 will make the zone of 1.3928-58 (weekly Fibo Kijun + monthly Senkou Span B) benchmarks.

This image is no longer relevant

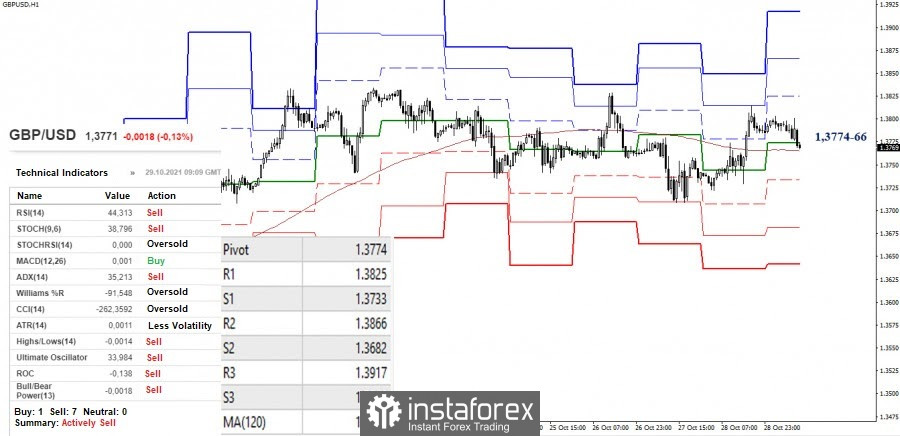
The key levels in the smaller timeframes (central pivot level 1.3774 + weekly long-term trend 1.3766) are currently joining forces with the daily center of gravity (1.3777). This area is currently being tested, so we can say that the market is dominated by uncertainty. Today's upward targets are set at 1.3825 - 1.3866 - 1.3917 (classic pivot levels), while the downward targets are at 1.3733 - 1.3682 - 1.3641 (classic pivot levels).

***

Ichimoku Kinko Hyo (9.26.52) and Kijun-sen levels in the higher time frames, as well as classic Pivot Points and Moving Average (120) on the H1 chart, are used in the technical analysis of the trading instruments.

Recommended Stories

Prediksi untuk GBP/USD pada 20 Agustus 2025

Pada grafik per jam, pasangan GBP/USD pada hari Selasa melanjutkan penurunan lemah dan bahkan terkonsolidasi di bawah level Fibonacci 76,4% – 1,3482. Namun, pagi ini para trader bullish melakukan serangan

Samir Klishi 10:33 2025-08-20 UTC+2

GBP/USD. Analisis Indikator pada 20 Agustus 2025

Pada hari Selasa, pasangan ini bergerak naik ke level 14,6% – 1,3527 (garis putus-putus kuning), kemudian turun dan ditutup pada 1,3487. Hari ini, kemungkinan akan melanjutkan pergerakan turunnya. Pada hari

Stefan Doll 09:48 2025-08-20 UTC+2

EUR/USD. Analisis Indikator pada 20 Agustus 2025

Pada hari Selasa, pasangan ini bergerak naik ke level 76,4% – 1,1697 (garis putus-putus kuning), kemudian turun dan ditutup pada 1,1645. Hari ini mungkin akan melanjutkan pergerakan turunnya. Pada hari

Stefan Doll 09:35 2025-08-20 UTC+2

#SPX. Risalah The Fed Mungkin Meningkatkan Permintaan untuk Saham AS

Kontrak CFD pada futures S&P 500, setelah penurunan yang signifikan pada hari Selasa, sudah menunjukkan tanda-tanda pemulihan pada hari Rabu di tengah ekspektasi yang masih kuat akan pemotongan suku bunga

Pati Gani 09:31 2025-08-20 UTC+2

Sinyal Trading untuk EUR/USD pada 20-23 Agustus 2025: beli di atas 1.1650 (200 EMA - 7/8 Murray)

Euro trading dalam saluran tren naik yang terbentuk sejak awal Agustus, tetapi menunjukkan tanda-tanda kelelahan. Jika terjadi rebound teknis di atas 1.1658, kita bisa mengharapkan EUR/USD mencapai 8/8 Murray sekitar

Dimitrios Zappas 06:37 2025-08-20 UTC+2

Sinyal Trading untuk BITCOIN pada 20-23 Agustus 2025: beli di atas $12.500 (4/8 Murray - pantulan)

Level 4/8 Murray yang terlihat pada grafik H4 merupakan support kuat untuk Bitcoin. Pada awal Agustus, dukungan ini memberikan dorongan bullish yang kuat untuk BTC, jadi kami percaya bahwa selama

Dimitrios Zappas 06:35 2025-08-20 UTC+2

Sinyal Trading untuk EMAS (XAU/USD) pada 20-23 Agustus 2025: jual di bawah $3.335 (pantulan - 2/8 Murray)

Jika tekanan bearish berlanjut dalam beberapa jam ke depan, kita bisa menjual di bawah 3.320 dengan target pada level psikologis 3.300 di sekitar 1/8 Murray. Kami pada akhirnya mengharapkan emas

Dimitrios Zappas 06:33 2025-08-20 UTC+2

Meskipun bias AUD/USD masih melemah, ada potensi penguatan pada hari ini, Rabu 20 Agustus 2025.

[AUD/USD] – [Rabu, 20 Agustus 2025] Meskipun EMA(50) & EMA (200) masih Death Cross, kemunculan divergence antara pergerakan harga AUD/USD dengan indikator RSI(14) memberi petunjuk jika dalam waktu dekat

Arief Makmur 05:57 2025-08-20 UTC+2

Minyak Mentah nampaknya akan meneruskan pelemahannya pada hari ini. Rabu 20 Agustus 2025.

[Minyak Mentah] – [Rabu, 20 Agustus 2025] Minyak Mentah hari ini berpotensi melanjutkan pelemahannya, dimana hal ini ditunjang oleh kondisi EMA(50) yang berada dibawah EMA(200) serta RSI(14) yang berada

Arief Makmur 05:55 2025-08-20 UTC+2

Prediksi EUR/USD untuk 20 Agustus 2025

Kemarin, euro menutup hari dengan penurunan 14 pip. Harga menghabiskan sebagian besar waktu mencoba melewati garis keseimbangan pada grafik harian, sehingga dukungan di 1.1632 baru tercapai pagi ini. Konsolidasi

Laurie Bailey 04:52 2025-08-20 UTC+2
Tidak bisa bicara sekarang?
Tanyakan pertanyaan anda lewat chat.
 

Dear visitor,

Your IP address shows that you are currently located in the USA. If you are a resident of the United States, you are prohibited from using the services of InstaFintech Group including online trading, online transfers, deposit/withdrawal of funds, etc.

If you think you are seeing this message by mistake and your location is not the US, kindly proceed to the website. Otherwise, you must leave the website in order to comply with government restrictions.

Why does your IP address show your location as the USA?

  • - you are using a VPN provided by a hosting company based in the United States;
  • - your IP does not have proper WHOIS records;
  • - an error occurred in the WHOIS geolocation database.

Please confirm whether you are a US resident or not by clicking the relevant button below. If you choose the wrong option, being a US resident, you will not be able to open an account with InstaTrade anyway.

We are sorry for any inconvenience caused by this message.