empty
29.10.2021 12:30 PM
Technical analysis recommendations of EUR/USD and GBP/USD on October 29

EUR/USD

This image is no longer relevant

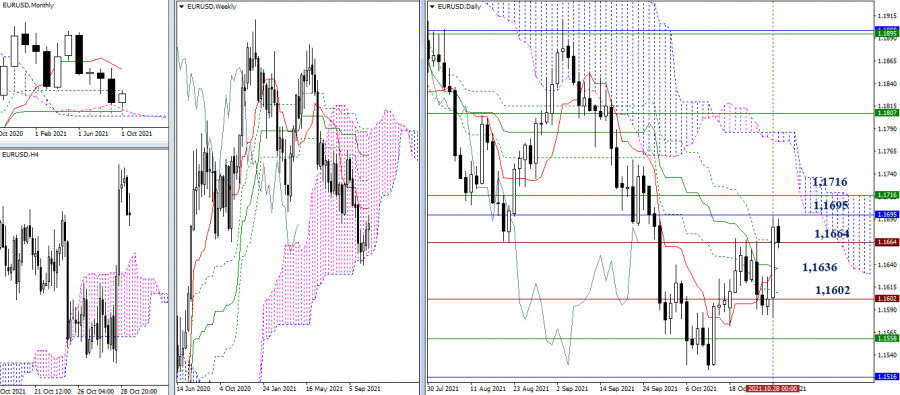
The end of the week and month is approaching. Yesterday, the bulls tried to break through the historical level of 1.1664. If the result can be consolidated in a weekly format, then the question of breaking through the resistance area of 1.1695 - 1.1716 (monthly Fibo Kijun + weekly Tenkan) will arise.

The failure to overcome the level of 1.1664, formation of a long upper shadow of the weekly candle and a return to the supports of 1.1636 (daily cross) or 1.1602 (historical level), will bring uncertainty back to the market.

This image is no longer relevant

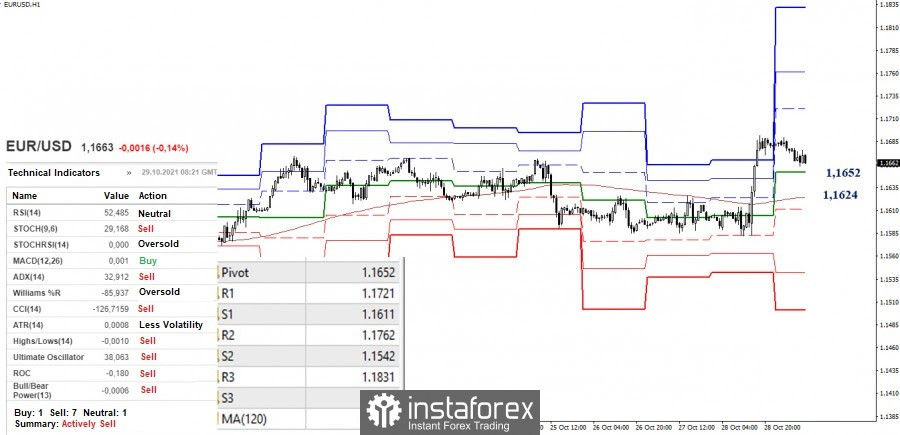
At the moment, there is a decline and test of the central pivot level (1.1652) in the smaller timeframes. The line of the weekly long-term trend (1.1624) is important for the bulls. In the case of consolidation below, the bears will regain their advantages. Their next pivot points will be the support of the classic pivot levels 1.1611 - 1.1542 - 1.1501. But if a rebound from the encountered support levels occurs in the near future and the high (1.1692) is updated, then bullish prospects will be represented by the resistances of the classic pivot levels 1.1721 - 1.1762 - 1.1831.

GBP/USD

This image is no longer relevant

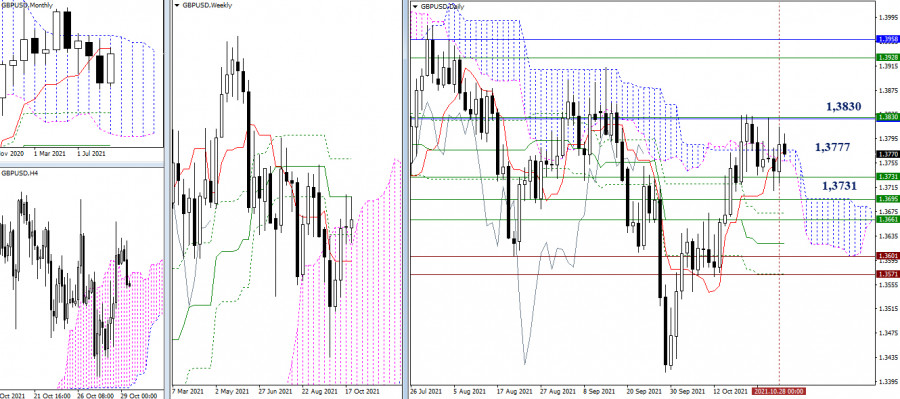
The situation could not be changed dramatically despite yesterday's bullish activity. The pair remained within the borders of 1.3830 (monthly short-term trend + weekly medium-term trend) and 1.3731 (weekly Fibo Kijun). In this case, the center of attraction is still the daily cloud (1.3777). Therefore, the possible prospects remained unchanged.

The breakdown of the support at 1.3731 will open the way to the next levels of 1.3695 (upper border of the weekly cloud) and 1.3661 (weekly short-term trend). The breakdown of the resistance at 1.3830 will make the zone of 1.3928-58 (weekly Fibo Kijun + monthly Senkou Span B) benchmarks.

This image is no longer relevant

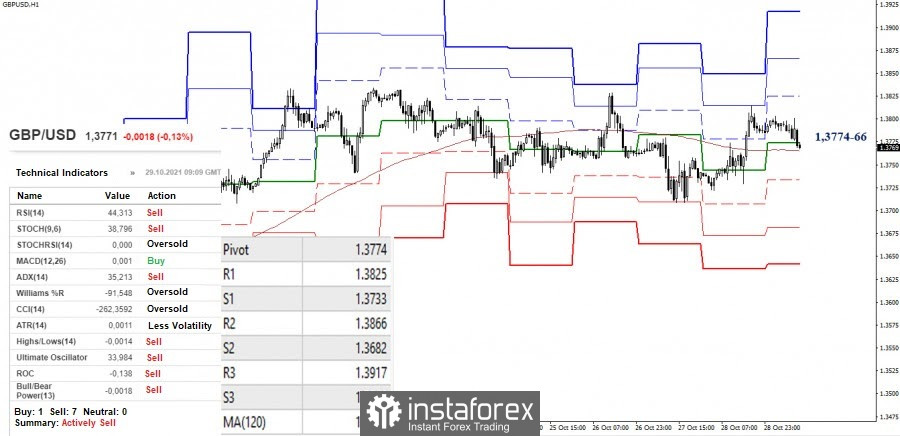
The key levels in the smaller timeframes (central pivot level 1.3774 + weekly long-term trend 1.3766) are currently joining forces with the daily center of gravity (1.3777). This area is currently being tested, so we can say that the market is dominated by uncertainty. Today's upward targets are set at 1.3825 - 1.3866 - 1.3917 (classic pivot levels), while the downward targets are at 1.3733 - 1.3682 - 1.3641 (classic pivot levels).

***

Ichimoku Kinko Hyo (9.26.52) and Kijun-sen levels in the higher time frames, as well as classic Pivot Points and Moving Average (120) on the H1 chart, are used in the technical analysis of the trading instruments.


Recommended Stories

USD/JPY: การวิเคราะห์และการพยากรณ์

วันนี้ คู่สกุลเงิน USD/JPY แสดงความแข็งแกร่งได้ที่ระดับต่ำกว่าค่าเฉลี่ยเคลื่อนที่อย่างง่าย (SMA) ระยะ 100 ชั่วโมง จากมุมมองทางเทคนิค คู่สกุลเงิน USD/JPY ได้แสดงความมั่นคงในวันนี้ต่ำกว่าค่าเฉลี่ยเคลื่อนที่อย่างง่าย (SMA) ระยะ

Irina Yanina 19:25 2025-07-17 UTC+2

GBP/USD: การวิเคราะห์ตัวชี้วัด วันที่ 17 กรกฎาคม

การวิเคราะห์แนวโน้ม (รูปที่ 1) ในวันพฤหัสบดี ตลาดอาจมีการเคลื่อนไหวต่อเนื่องในทิศทางขาลงจากระดับ 1.3417 (ราคาปิดรายวันของเมื่อวาน) โดยมีเป้าหมายที่ 1.3369 – เซตต่ำสุดในอดีต (เส้นประสีเหลือง) จากระดับนี้ ราคาอาจดีดตัวขึ้นไปสู่ระดับ 1.3405

Stefan Doll 12:12 2025-07-17 UTC+2

การพยากรณ์ค่าเงิน Forex 17/07/2025: EUR/USD, GBP/USD, USD/JPY, SP500 และ Bitcoin

ลิงก์ที่มีประโยชน์: บทความอื่นๆ ของฉันมีอยู่ในส่วนนี้ คอร์ส InstaForex สำหรับผู้เริ่มต้น การวิเคราะห์ที่เป็นที่นิยม เปิดบัญชีเทรด สำคัญ: ผู้เริ่มต้นในการเทรด forex จำเป็นต้องระมัดระวังอย่างมากเมื่อทำการตัดสินใจเกี่ยวกับการเข้าสู่ตลาด ก่อนที่รายงานสำคัญจะออกมา แนะนำให้หลีกเลี่ยงการเข้าตลาดเพื่อป้องกันการถูกจับตาในความผันผวนของตลาดที่เกิดจากความแปรปรวนที่เพิ่มขึ้น หากคุณตัดสินใจที่จะซื้อขายในช่วงการประกาศข่าว

Sebastian Seliga 12:08 2025-07-17 UTC+2

EUR/USD: การวิเคราะห์อินดิเคเตอร์เมื่อวันที่ 17 กรกฎาคม

การวิเคราะห์แนวโน้ม (รูปที่ 1) ในวันพฤหัสบดี ตลาดอาจยังคงเคลื่อนตัวลงต่อจากระดับ 1.1639 (ราคาปิดรายวันเมื่อวานนี้) โดยมีเป้าหมายที่ 1.1560 ซึ่งเป็นระดับการปรับตัวลง 61.8% (เส้นประสีแดง) เมื่อทดสอบระดับนี้แล้ว ราคามีความเป็นไปได้ที่จะดีดตัวกลับขึ้นไปยังระดับ 1.1588

Stefan Doll 11:45 2025-07-17 UTC+2

EUR/USD. วันที่ 17 กรกฎาคม ทรัมป์ต้องการไล่พาวเวลอีกครั้ง

เมื่อวันพุธ คู่เงิน EUR/USD ไปถึงระดับการปรับตัว 100.0% ที่ 1.1574 และดีดตัวขึ้นจากจุดนั้น โดยขึ้นไปถึงระดับ Fibonacci 127.2% ที่ 1.1712 ซึ่งก็มีการดีดตัวอีกเช่นกัน ผลที่เกิดขึ้นจากการหยุดกลับตัวล่าสุดนี้เป็นประโยชน์ต่อเงินดอลลาร์สหรัฐ

Samir Klishi 11:23 2025-07-17 UTC+2

GBP/USD. 17 กรกฎาคม อัตราการว่างงานในสหราชอาณาจักรยังคงเพิ่มขึ้น

บนกราฟรายชั่วโมง คู่เงิน GBP/USD ฟื้นตัวเมื่อวันพุธจากโซนแนวรับที่ระดับ 1.3357–1.3371 และเพิ่มขึ้นสู่ระดับการปรับฐาน 76.4% ที่ 1.3470 การฟื้นตัวจาก 1.3470 ทำให้เกิดการกลับทิศทางที่เป็นบวกต่อตลาดเงินดอลลาร์สหรัฐและลดลงใหม่ไปยังโซน 1.3357–1.3371 การฟื้นตัวใหม่จากโซนนี้จะสนับสนุนเงินปอนด์อีกครั้ง และนำไปสู่การเติบโตสู่ระดับ

Samir Klishi 11:15 2025-07-17 UTC+2

อะไรที่ฉุดรั้งการฟื้นตัวอย่างมั่นใจในตลาดหุ้นสหรัฐ? (AUD/USD: ดอลลาร์สหรัฐแข็งค่า)

ความเป็นไปได้ที่สูงที่ธนาคารกลางสหรัฐจะไม่สามารถกลับมาลดอัตราดอกเบี้ยได้ในปีนี้ กำลังให้การสนับสนุนอย่างมากต่อดอลลาร์สหรัฐ ดัชนีดอลลาร์อาจทะลุเหนือระดับ 99.00 ภายในสิ้นสัปดาห์นี้ และอาจยังคงเพิ่มขึ้นต่อไปในสัปดาห์หน้า อีกปัจจัยหนึ่งที่ส่งผลคือความไม่แน่นอนที่เกิดขึ้นใหม่จากการที่ Trump ได้แนะนำว่าหนังสือภาษีศุลกากรจะจบลงอย่างไร จากมุมมองทางเทคนิค คู่เงิน AUD/USD ยังคงอยู่ในแนวโน้มด้านข้างในระยะสั้น แต่ถ้าดอลลาร์ยังคงแข็งแกร่งต่อไป อาจนำไปสู่การลดลงอย่างเห็นได้ชัด

Pati Gani 10:13 2025-07-17 UTC+2

DXY มีศักยภาพในการทดสอบระดับ Pivot แต่ยังมีโอกาสที่จะเสริมความแข็งแกร่งเพิ่มเติมในวันพฤหัสบดีที่ 17 กรกฎาคม 2025

ดัชนีดอลล่าร์สหรัฐ – วันพฤหัสบดีที่ 17 กรกฎาคม 2025 หากระดับ Pivot และ Support สามารถรองรับการแก้ไขการอ่อนตัวของ #USDX ได้ในระยะสั้น #USDX มีศักยภาพที่จะยังคงแข็งแกร่งต่อไป

Arief Makmur 08:47 2025-07-17 UTC+2

ดัชนี Nasdaq 100 มีโอกาสที่จะอ่อนตัวลงและลดลงไปยังระดับแนวรับที่ใกล้ที่สุดในวันพฤหัสบดีที่ 17 กรกฎาคม 2025

ดัชนี Nasdaq 100 - วันพฤหัสบดีที่ 17 กรกฎาคม 2025 การเคลื่อนไหวของราคา #NDX อยู่ต่ำกว่าค่าเฉลี่ยเคลื่อนที่ EMA(20) และ EMA(50) โดยสนับสนุนด้วย

Arief Makmur 08:47 2025-07-17 UTC+2

มุมมองต่อการลดลงของตลาดหุ้นผ่านอัตราแลกเปลี่ยน EUR/JPY

ในประวัติศาสตร์ การที่นักลงทุนถอนตัวออกจากตลาดหุ้นมักจะสะท้อนออกมาในรูปแบบของการลดลงของคู่สกุลเงิน EUR/JPY เนื่องจากเป็นการสะท้อนการออกจากสกุลเงินที่มีความเสี่ยง (เช่น ยูโร) ไปสู่สกุลเงินที่ปลอดภัยขึ้น (เช่น ดอลลาร์และเยน) ดังนั้น ความตื่นตระหนกในตลาดจึงมักแปลเป็นการลดลงอย่างรวดเร็วของ EUR/JPY และในขณะนี้ดูเหมือนว่าจะเป็นช่วงเวลาหนึ่งของสถานการณ์เช่นนั้น ในกราฟรายสัปดาห์ ราคาปรับตัวขึ้นมาถึงเส้นแนวแชนเนลที่เป็นแนวต้านสำคัญซึ่งมีต้นกำเนิดจากเดือนพฤษภาคม

Laurie Bailey 07:41 2025-07-17 UTC+2
หากไม่สะดวกคุยในตอนนี้
ระบุคำถามไว้ได้ใน แชท.
 

Dear visitor,

Your IP address shows that you are currently located in the USA. If you are a resident of the United States, you are prohibited from using the services of InstaFintech Group including online trading, online transfers, deposit/withdrawal of funds, etc.

If you think you are seeing this message by mistake and your location is not the US, kindly proceed to the website. Otherwise, you must leave the website in order to comply with government restrictions.

Why does your IP address show your location as the USA?

  • - you are using a VPN provided by a hosting company based in the United States;
  • - your IP does not have proper WHOIS records;
  • - an error occurred in the WHOIS geolocation database.

Please confirm whether you are a US resident or not by clicking the relevant button below. If you choose the wrong option, being a US resident, you will not be able to open an account with InstaTrade anyway.

We are sorry for any inconvenience caused by this message.