Double Bottom
was formed on 04.06 at 21:30:26 (UTC+0)
signal strength 1 of 5
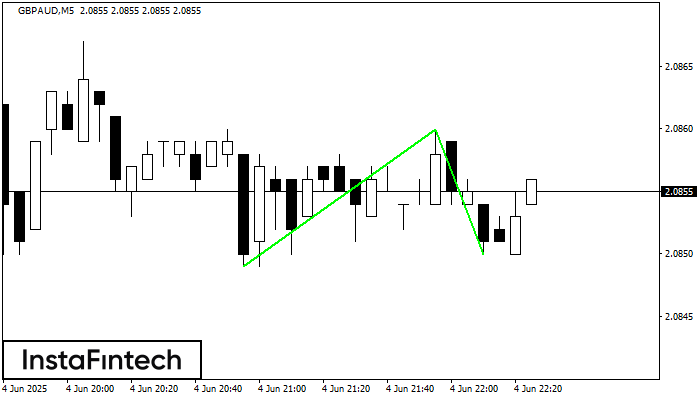
The Double Bottom pattern has been formed on GBPAUD M5; the upper boundary is 2.0860; the lower boundary is 2.0850. The width of the pattern is 11 points. In case of a break of the upper boundary 2.0860, a change in the trend can be predicted where the width of the pattern will coincide with the distance to a possible take profit level.
The M5 and M15 time frames may have more false entry points.
See Also
- All
- All
- Bearish Rectangle
- Bearish Symmetrical Triangle
- Bullish Rectangle
- Double Top
- Double Top
- Triple Bottom
- Triple Bottom
- Triple Top
- Triple Top
- All
- All
- Buy
- Sale
- All
- 1
- 2
- 3
- 4
- 5
Pennant Aliran Menurun
was formed on 11.07 at 21:00:55 (UTC+0)
signal strength 3 of 5
Corak Pennant Aliran Menurun telah dibentuk pada carta #NTDOY M30. Corak menandakan kesinambungan aliran menurun sekiranya aliran pennant rendah 21.38 ditembusi. Cadangan: Meletakkan pesanan penanguhan sell stop
Open chart in a new window
Pennant Aliran Menurun
was formed on 11.07 at 21:00:32 (UTC+0)
signal strength 3 of 5
Corak Pennant Aliran Menurun telah dibentuk pada carta #NTDOY M30. Corak menandakan kesinambungan aliran menurun sekiranya aliran pennant rendah 21.38 ditembusi. Cadangan: Meletakkan pesanan penanguhan sell stop
Open chart in a new window
Double Top
was formed on 11.07 at 20:00:15 (UTC+0)
signal strength 2 of 5
Pada carta #TSLA M15 corak pembalikan Double Top telah terbentuk. Ciri-ciri: sempadan atas 311.31; sempadan bawah 306.40; lebar corak 491 mata. Isyarat: penembusan sempadan bawah akan menyebabkan kesinambungan arah aliran
Carta masa M5 dan M15 mungkin mempunyai lebih banyak titik kemasukan palsu.
Open chart in a new window