
See also


 24.09.2026 05:37 AM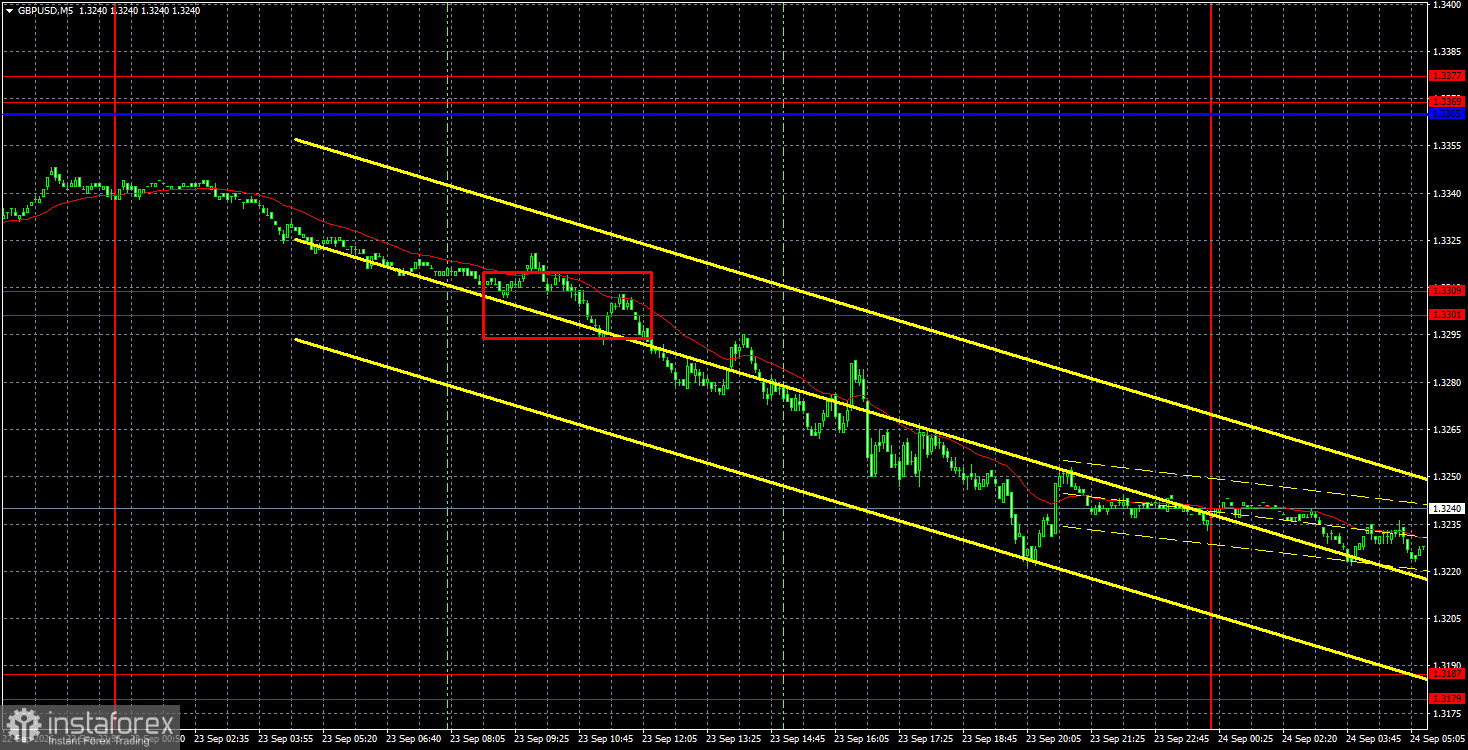
The GBP/USD pair fell 160 pips on Tuesday and Wednesday. The British currency's free fall continues, though there are no clear reasons for it. Yesterday, neither the macroeconomic, fundamental, nor geopolitical backdrop could have provoked a new rise in the US dollar. Yes, this week several members of the Federal Reserve's policy committee said monetary tightening must continue. But did the market expect anything else? And how much longer will the dollar rise on expectations of future key rate hikes? And when the Fed conducts one or two more tightenings, will the dollar rise again simply because rates have been raised? In general, we do not consider the current southbound movement to be natural or logical. Formal reasons for the dollar's rise exist, but they are merely formal. Practically all factors in favor of the British pound have been ignored for several months now. Recall that inflation remains above target not only in the US but also in the UK. Therefore, the Bank of England will almost certainly tighten policy by the end of 2026 and in early 2027.
Technically, the pound continues to form a downward trend, as shown by the trend line and the price below the Ichimoku indicator lines. At best, the pound can expect a correction within the downtrend. Despite the absence of local bearish factors, we do not see any market appetite to buy the British currency at this time.
On the 5-minute TF on Wednesday, one sell trading signal was formed. During the European session, the price broke the 1.3301–1.3309 area, allowing traders to open short positions. By the end of the day, they could be closed with good profit, or carried into Thursday, as the pound may well continue to fall today.
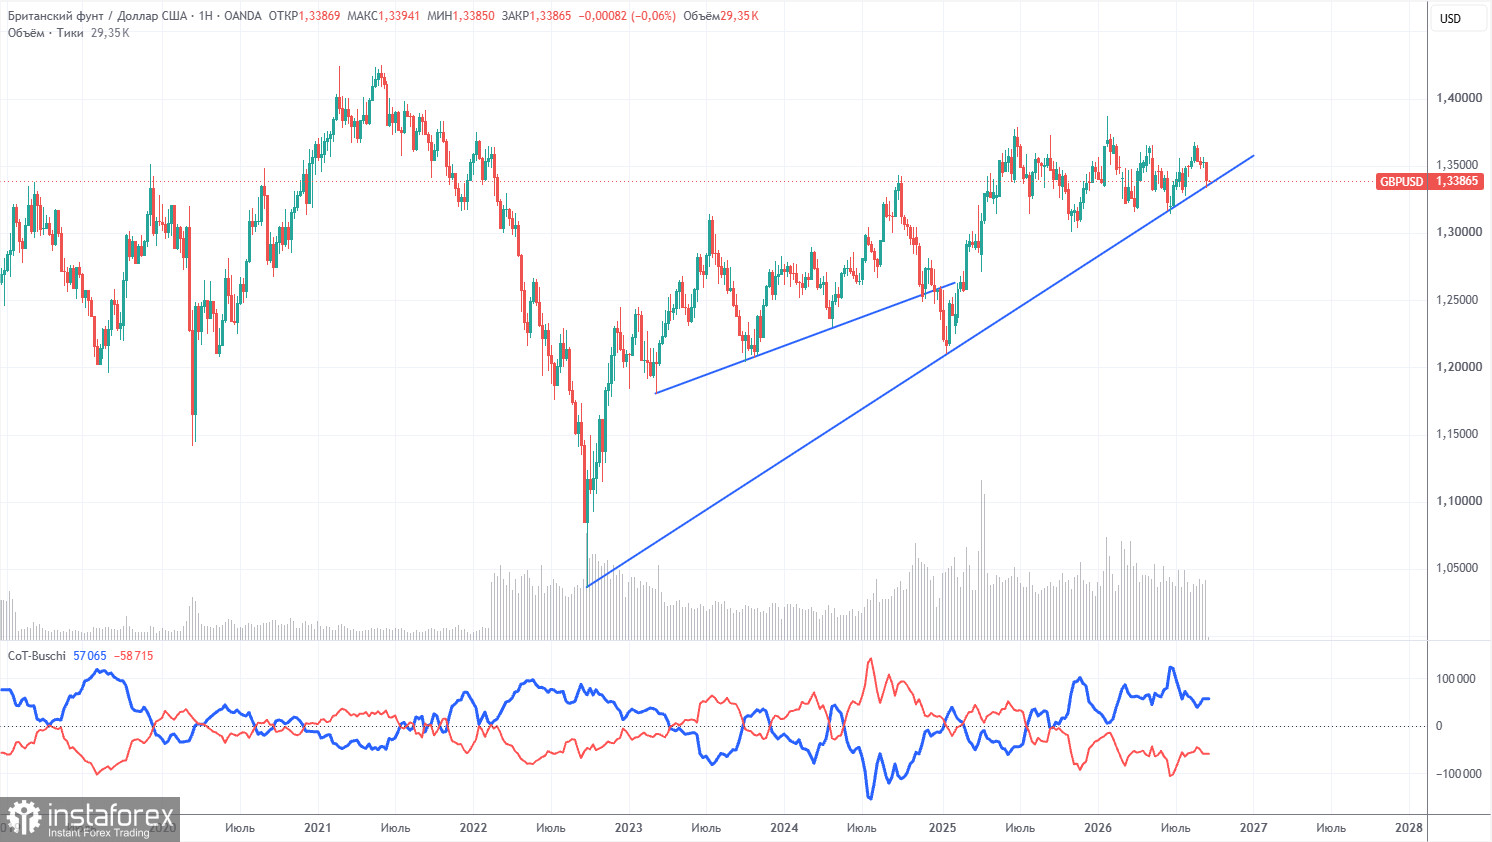
COT reports for the pound show that non-commercial traders have dominated the market with short positions for several months. The net position is negative despite the persistent long-term uptrend. Given events in the Middle East, it is unsurprising that dollar demand was high in the first half of 2026. The war is formally over, but the conflict persists. Only geopolitics can support the US dollar in the near term. However, until the pair closes below the trend line, we don't expect a strong, sustained decline.
In the long run, the dollar continues to weaken due to Trump's policies, as seen on the weekly timeframe. The trade war will continue in one form or another, and Trump's policy aims directly and indirectly to weaken the US currency. The long-term uptrend remains, as indicated by the trend line. Price recently tested that line and bounced off it. According to the latest COT report (dated September 15), the "Non-commercial" group closed 4,200 BUY contracts and 4,300 SELL contracts. Thus, the non-commercial traders' net position rose by 100 contracts over the week.
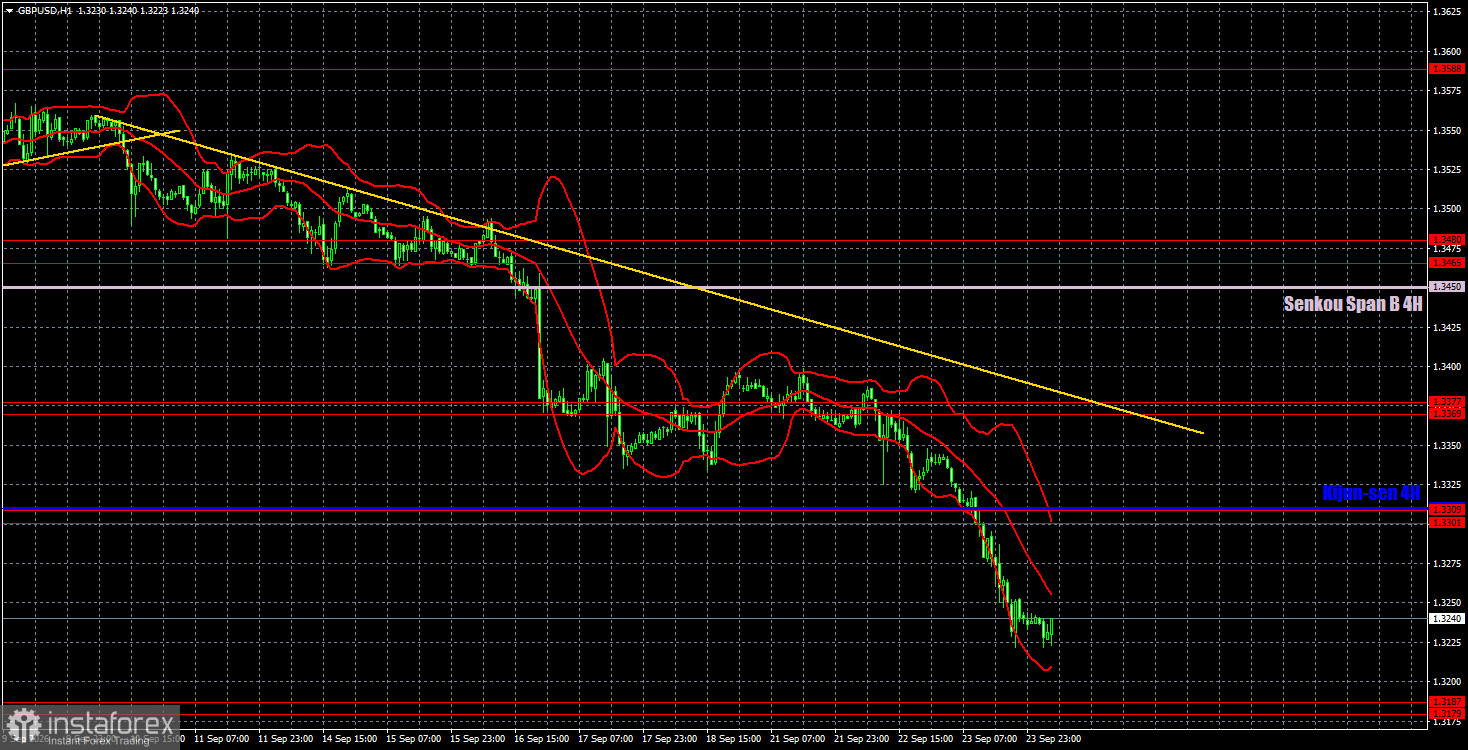
On the hourly timeframe the GBP/USD pair continues forming a downward trend. The Fed's decision and stance have changed prospects for the US dollar and the market's attitude toward it significantly. We would say that for the second time this year a "black swan" has arrived that brought excellent news for the dollar when no one expected it. Thus, now one should doubt the pound's upside potential.
For September 24 we highlight the following important levels: 1.3042–1.3050, 1.3096–1.3115, 1.3179–1.3187, 1.3301–1.3309, 1.3369–1.3377, 1.3465–1.3480, 1.3588, 1.3671–1.3681. The Senkou Span B line (1.3450) and the Kijun-sen (1.3310) can also be sources of signals. It is recommended to move the Stop Loss to breakeven if the price moves 20 pips in the correct direction. The Ichimoku indicator lines may shift during the day, which should be taken into account when determining trading signals.
No important releases are scheduled today in the UK or the US. Thus, traders will have nothing to react to today, but traders currently do not need any events to make trading decisions. The inertial and illogical rise of the US currency continues.
Today traders can remain in short positions with a target of 1.3179–1.3187, since a sell signal was formed yesterday in the 1.3301–1.3309 area. Long positions can be opened in case of a rebound from the 1.3179–1.3187 area with a target of 1.3301–1.3309.
Support and resistance price levels are thick red lines where movement may conclude. They are not sources of trading signals.
The Kijun-sen and Senkou Span B lines are Ichimoku indicator lines transferred to the hourly timeframe from the 4-hour timeframe. They are strong lines.
Extreme levels are thin red lines from which the price has previously rebounded. They are sources of trading signals.
Yellow lines indicate trend lines, trending channels, and any other technical patterns.
Indicator 1 on COT charts shows the size of the net position of each category of traders.


