See also

 24.06.2025 03:45 AM
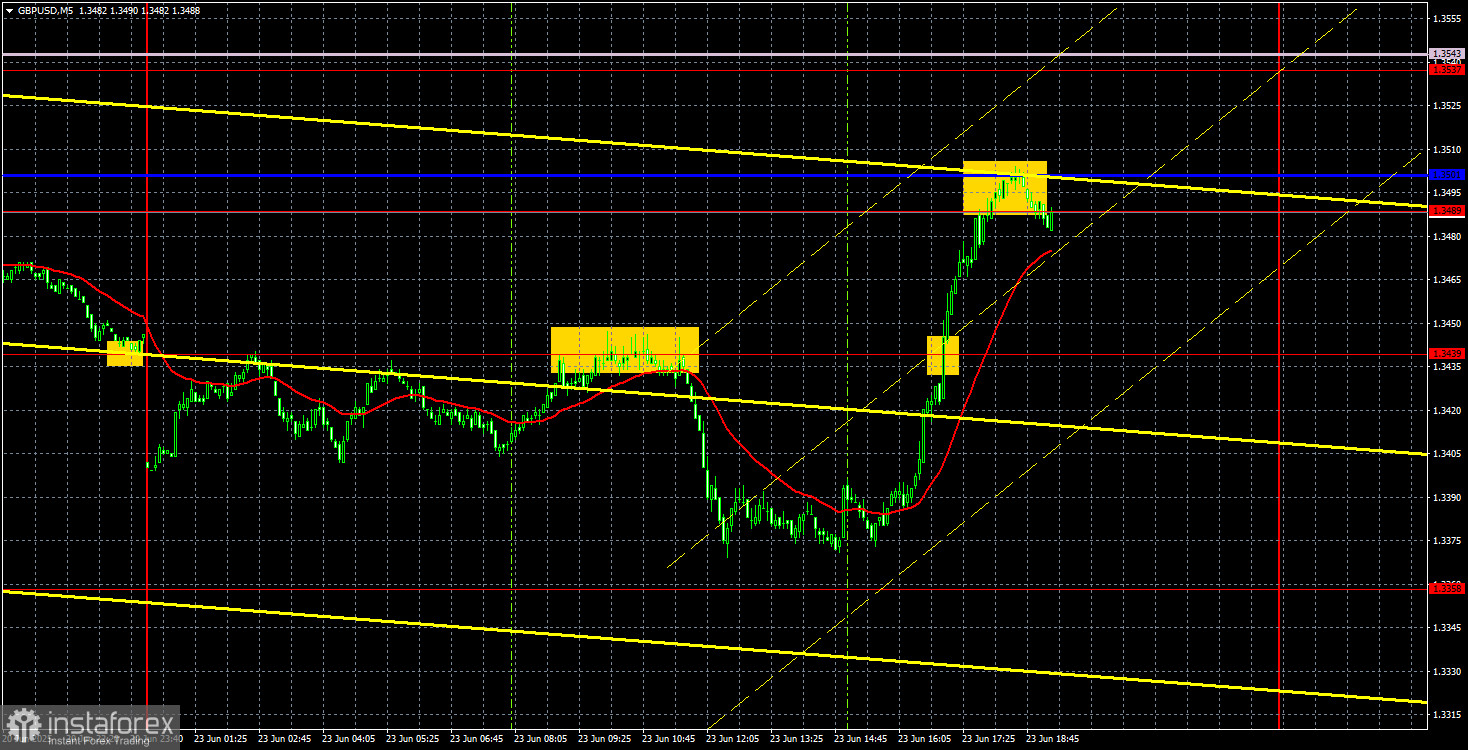
On Monday, the GBP/USD currency pair traded differently than expected. Many anticipated a strong surge in the U.S. dollar, a sharp fall, or "rollercoaster-like" price swings throughout the day. In reality, movements were alternating and relatively smooth. Overnight, the dollar did strengthen—but very weakly—and by the start of the European session, it had lost all its advantage. It was in demand again during the European session, but it began to lose ground rapidly in the U.S. session. Thus, one thing is clear—the U.S. dollar gained nothing from the attack on Iran.
Notably, the dollar's decline in the second half of the day was in no way linked to macroeconomic data from overseas. The dollar was already falling well before the release of relatively minor S&P services and manufacturing PMIs. Note that the U.S. also publishes its own, more influential ISM business activity indices. Therefore, once again, the only thing the dollar could achieve was minimal growth—which can quickly and easily fade.
The pair maintains a downtrend, supported by two lines of the Ichimoku indicator, although the trendline has already been broken. In the 5-minute timeframe, the price produced a perfect sell signal during the European session by rebounding precisely from the 1.3439 level. Unfortunately, the dollar's growth ended quickly, and the target level wasn't reached. In the second half of the day, the price broke through 1.3439 and reached the next target in the 1.3489–1.3501 area.
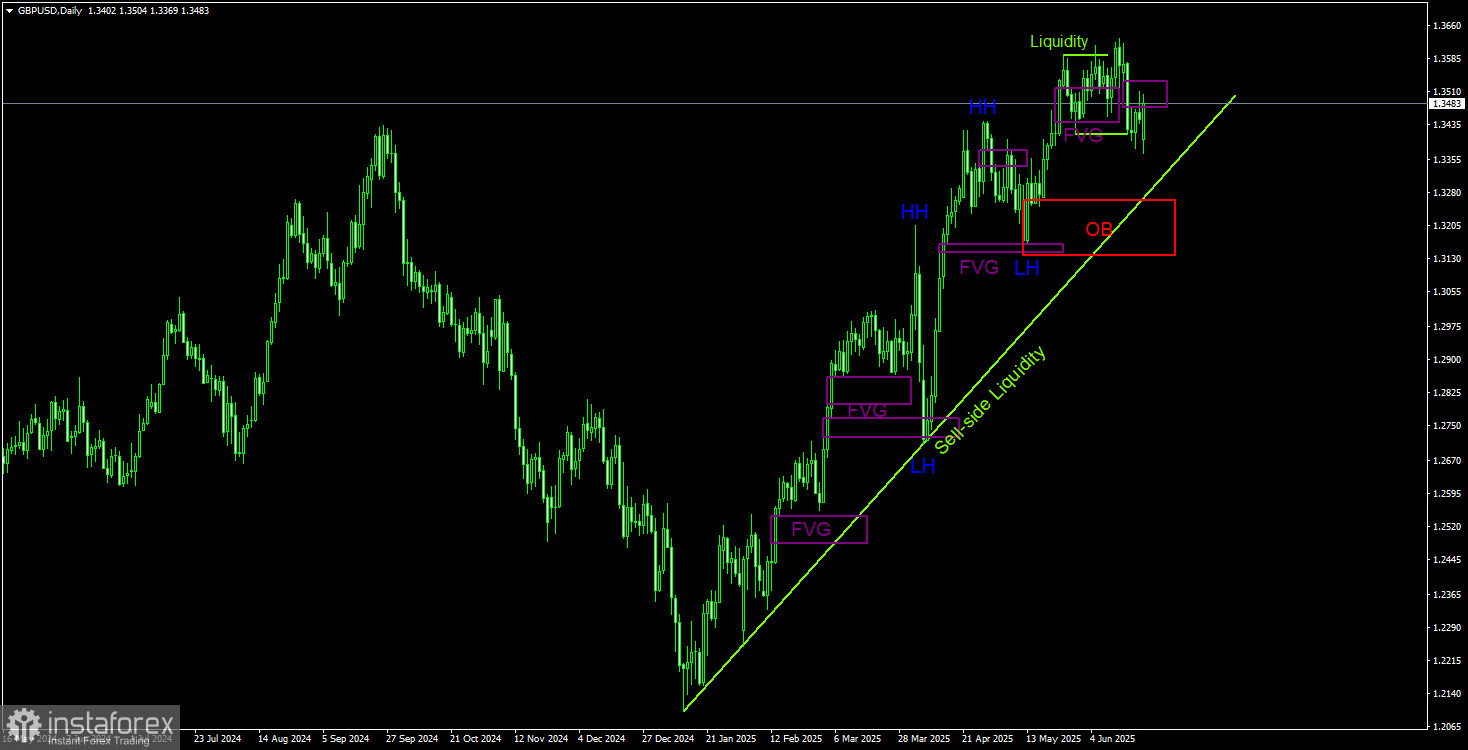
A strong uptrend is evident in the daily timeframe under the ICT method. The recent decline should not mislead traders—it may just be a liquidity grab before a new rise. Therefore, growth in the British currency may resume as early as this week.
However! Last week, a new bearish Fair Value Gap (FVG) was formed, which triggered a market reaction on Friday. Thus, a sell signal has appeared during a bullish trend, and the pound does have room to fall. An obvious target for such a decline is the Order Block. However, the top priority remains the news background, which could easily nullify this signal and distort the technical picture. The sell signal is present, but acting on it is fairly risky.
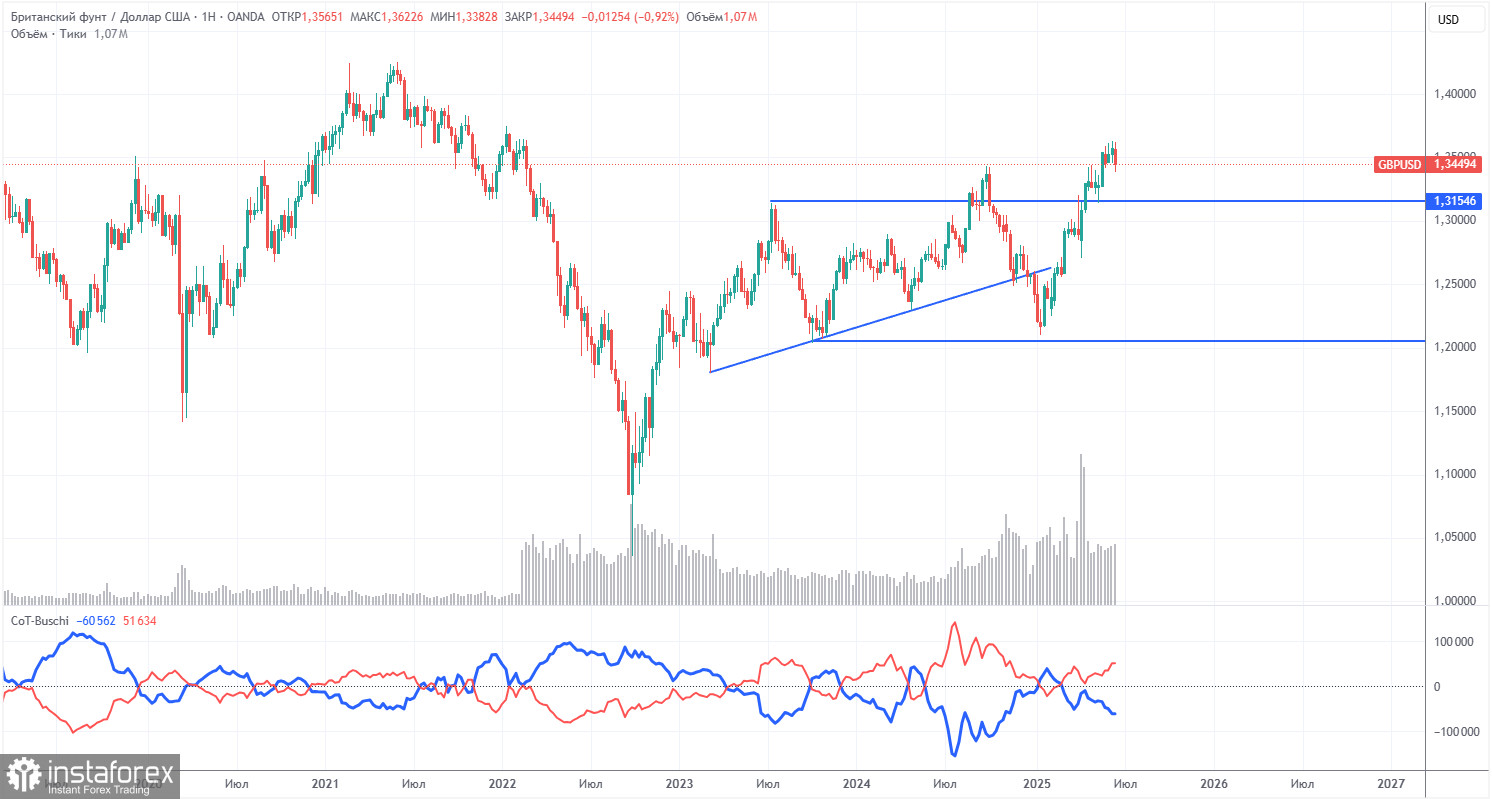
COT reports for the British pound show that commercial traders' sentiment has fluctuated frequently in recent years. The red and blue lines, representing net positions of commercial and non-commercial traders, often intersect and usually hover near zero. They also remain close now, indicating an approximately equal number of long and short positions. However, over the past 18 months, the net position has been trending upward.
The dollar continues to weaken due to Donald Trump's policies, so the current interest of market makers in the pound isn't particularly relevant. If the global trade war begins to de-escalate, the U.S. dollar may have a chance to strengthen. According to the latest report on the British pound, the "Non-commercial" group opened 7,400 new long contracts and closed 9,000, resulting in a weekly net increase of 16,400 contracts—a notable shift.
The pound has risen sharply lately, but it's important to remember that the primary reason is Trump's policy agenda. Once that factor is neutralized, the dollar could start to gain again—but no one knows when that will happen. The dollar is still in the early stages of Trump's presidency. What further shocks await over the next four years?
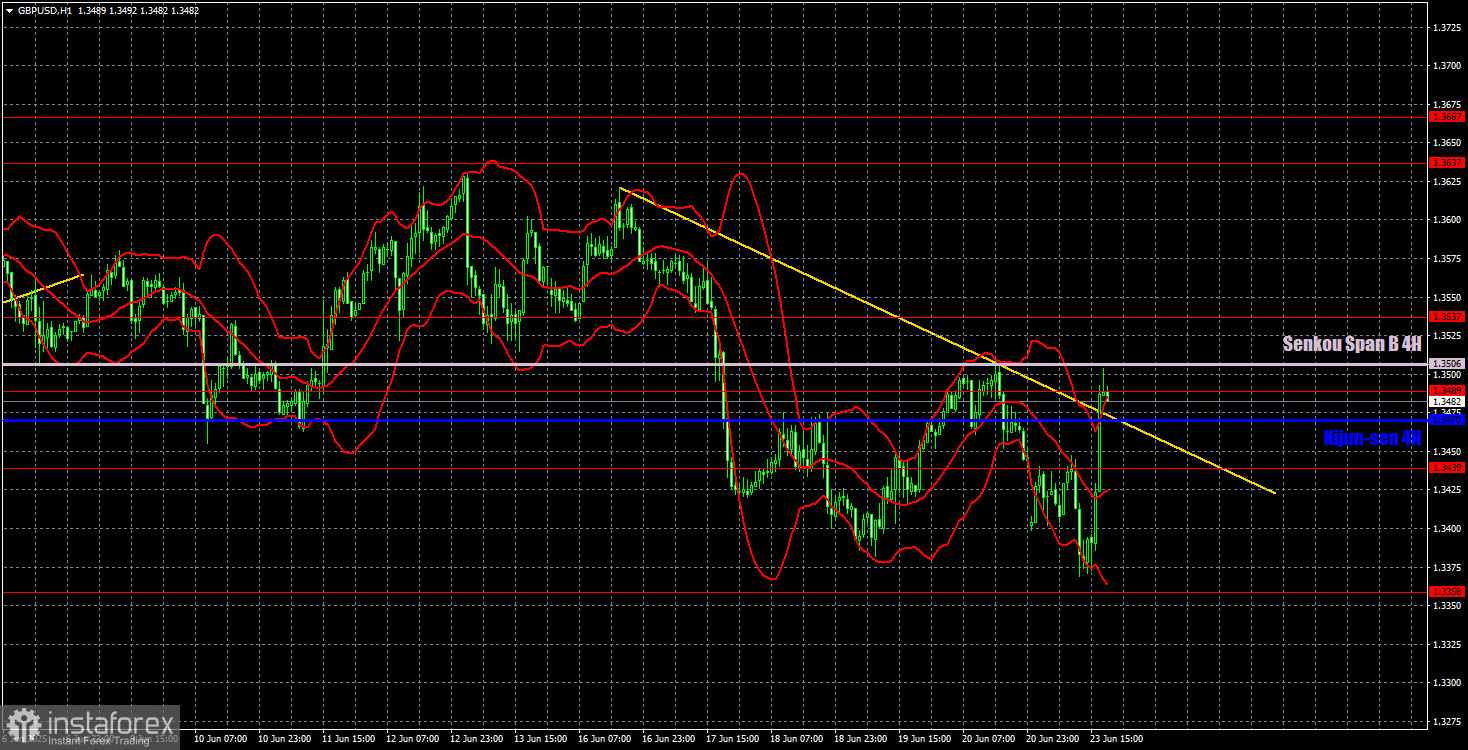
In the hourly timeframe, GBP/USD formed a downtrend that could end anytime. The dollar sees occasional corrections, but the market remains focused on buying in the medium term. The technical picture on the hourly chart currently favors the dollar. The daily chart also favors the dollar in the short term. However, the dollar's overall position over the past five months has been so weak that expecting meaningful strengthening remains difficult.
For June 24, we highlight the following important levels: 1.3050, 1.3125, 1.3212, 1.3288, 1.3358, 1.3439, 1.3489, 1.3537, 1.3637–1.3667, 1.3741. Senkou Span B (1.3506) and Kijun-sen (1.3470) lines can also be sources of signals. A Stop Loss should be placed to breakeven if the price moves 20 pips in the desired direction. Ichimoku lines may shift throughout the day and must be accounted for when identifying signals.
No major macroeconomic reports are scheduled for the U.S. or the UK. However, Jerome Powell is scheduled to speak in the U.S. While this is potentially an important event, we do not expect the Fed Chair to share anything significant with traders just a few days after the latest FOMC meeting.


