See also
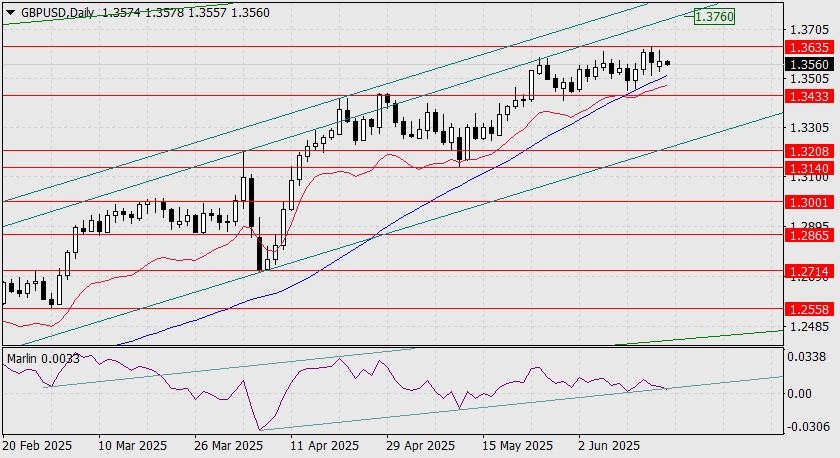
The British pound is gradually squeezed between the MACD line on the daily chart and the resistance level at 1.3635. The key question now is: which direction will the price break in the coming days?
The Marlin oscillator testing the lower boundary of its own channel increases the likelihood of an upward breakout. A confirmation would be a break above the 1.3635 level. The nearest target would then be the inner price channel line at 1.3760, followed potentially by continued growth toward 1.3834—the peak from October 2021.
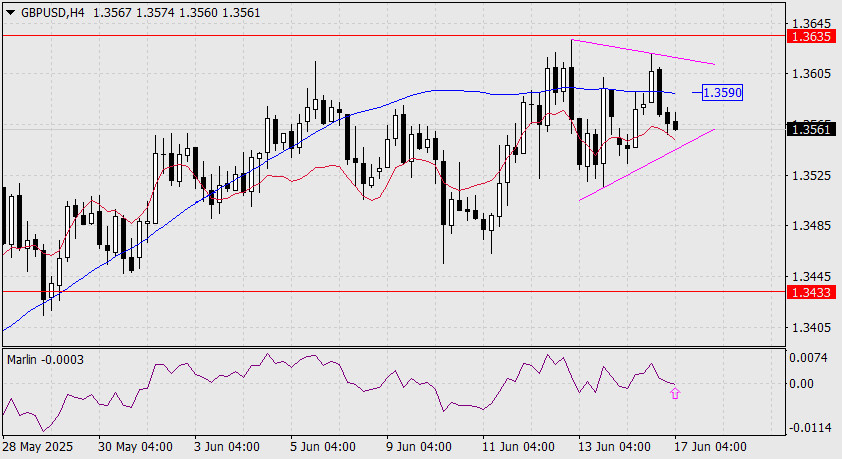
The price is currently moving below the MACD line on the four-hour chart, but this is generally a neutral sign within triangular formations. However, if the price consolidates above the MACD line (1.3590), it would signal an upcoming bullish breakout from the triangle, especially since no firm break above this line has occurred since the triangle's formation.
The Marlin oscillator's signal line shows an intention to turn upward from the zero line, which is an additional sign of a possible pound rally.
Today, the U.S. will release May retail sales data (forecast: -0.6% after a modest 0.1% increase in April) and industrial production data (expected at 0.0% growth). Such figures could help prevent the pound from falling in the short term.
You have already liked this post today
*The market analysis posted here is meant to increase your awareness, but not to give instructions to make a trade.
Useful links: My other articles are available in this section InstaForex course for beginners Popular Analytics Open trading account Important: The begginers in forex trading need to be very careful
The Eagle indicator is signaling a negative sequence, so we believe that any technical rebound, as long as the price trades below the 8/8 Murray level, will be seen
Technically, the euro is reaching exhaustion levels. In the latest trading, Japanese candlesticks called dojis can be seen on the technical chart, indicating market indecision. A technical correction is likely
S&P 500 Index – Thursday, July 24, 2025. With the Golden Cross EMA(50) above the EMA(200), buyers are quite dominant. Although the RSI(14) indicator is at a neutral bullish level
Nasdaq 100 Index – Thursday, July 24, 2025. By the appearance of divergence between the Nasdaq 100 Index price movement and the RSI(14) indicator indicates that #NDX has the potential
Ferrari F8 TRIBUTO
from InstaTrade
Your IP address shows that you are currently located in the USA. If you are a resident of the United States, you are prohibited from using the services of InstaFintech Group including online trading, online transfers, deposit/withdrawal of funds, etc.
If you think you are seeing this message by mistake and your location is not the US, kindly proceed to the website. Otherwise, you must leave the website in order to comply with government restrictions.
Why does your IP address show your location as the USA?
Please confirm whether you are a US resident or not by clicking the relevant button below. If you choose the wrong option, being a US resident, you will not be able to open an account with InstaTrade anyway.
We are sorry for any inconvenience caused by this message.