See also

 10.06.2025 06:22 PM
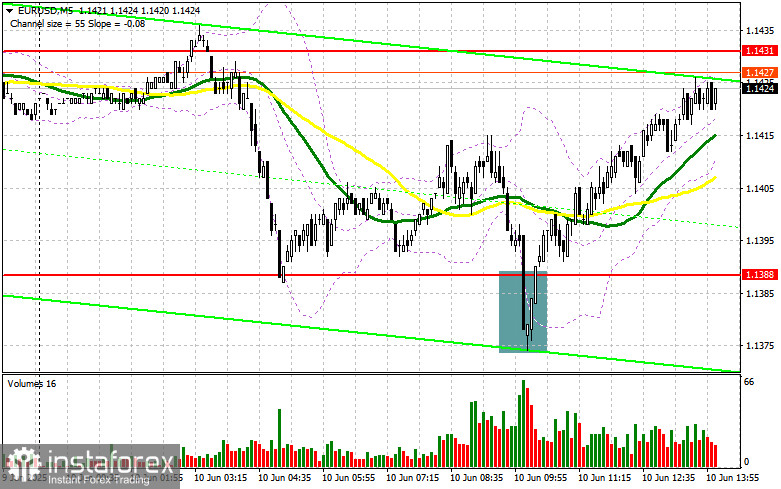
In my morning forecast, I highlighted the level of 1.1388 and planned to make market entry decisions based on it. Let's take a look at the 5-minute chart to see what happened. A decline and the formation of a false breakout around 1.1388 led to a buy signal for the euro, resulting in a rise of more than 40 points. The technical picture was not revised for the second half of the day.
To Open Long Positions on EUR/USD:
Solid industrial production data from Italy and encouraging figures from the Sentix investor confidence index helped euro buyers withstand pressure and return to the market. Unfortunately, the only notable U.S. data ahead is the NFIB Small Business Optimism Index, which is unlikely to affect the market much. Thus, all focus remains on the ongoing trade talks between U.S. and Chinese officials in London.
If the pair declines and the market reacts negatively, the focus will shift to protecting the 1.1388 support level. A false breakout there, similar to the one discussed earlier, will serve as a signal to buy EUR/USD, targeting a return to the 1.1431 resistance zone, where the pair is currently trading. A breakout and retest of this range from above will confirm the entry point and open the way to 1.1459. The furthest target is 1.1492, where I plan to take profits.
If EUR/USD declines and there is no activity around 1.1388, selling pressure will likely increase, pushing the pair down to 1.1361. Only a false breakout at this level will prompt me to buy the euro. I plan to open long positions on a bounce from 1.1314, aiming for a 30–35 point intraday correction.
To Open Short Positions on EUR/USD:
Sellers made a decent attempt in the first half of the day but failed to break below the weekly low. They'll get another chance in the second half, so not all is lost. Strong U.S. data and positive developments in U.S.–China negotiations would benefit the dollar.
A false breakout around the 1.1431 resistance level will be a reason to open short positions, targeting a drop to 1.1388. A breakout and consolidation below this range will support further selling, with the next target at 1.1361. The ultimate downside target is 1.1314, where I will take profit.
If EUR/USD moves upward in the second half of the day and sellers remain inactive at 1.1431, buyers could push the pair further to 1.1459. I will only sell there if the pair fails to hold above that level. I also plan to open short positions on a bounce from 1.1492, targeting a 30–35 point intraday decline.
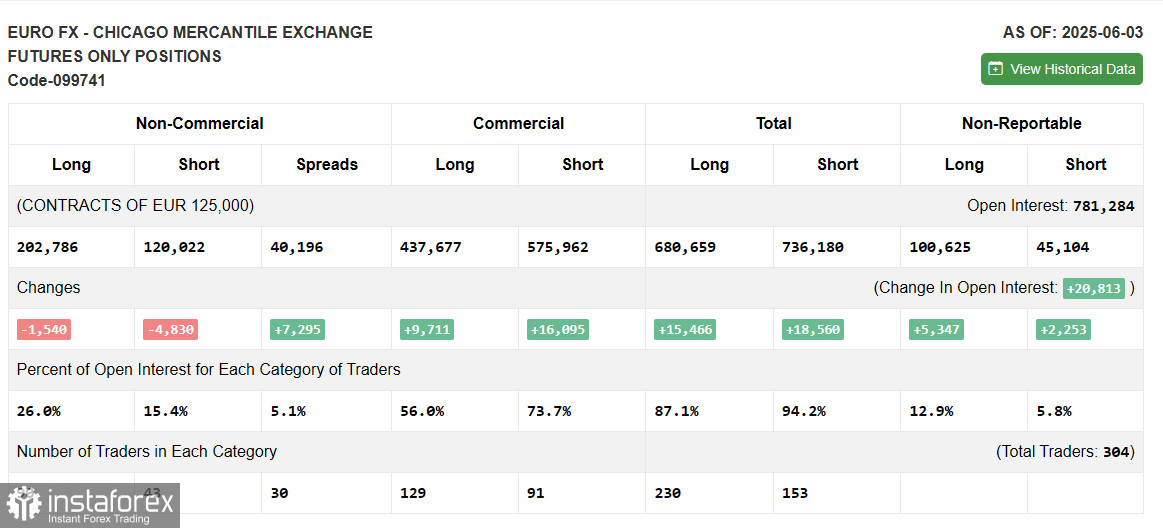
COT Report (Commitment of Traders) – June 3:
The report showed reductions in both long and short positions. The ECB's decision to cut rates was expected and did not significantly alter market dynamics. However, expectations that the regulator will pause the easing cycle strengthened the euro's position. A solid GDP report from the eurozone also supports the case for further euro appreciation. Unsurprisingly, short positions decreased more than long ones. The COT report showed long non-commercial positions down by 1,540 to 202,786, and short non-commercial positions down by 4,830 to 120,022. As a result, the gap between long and short positions widened by 7,295.
Indicator Signals:
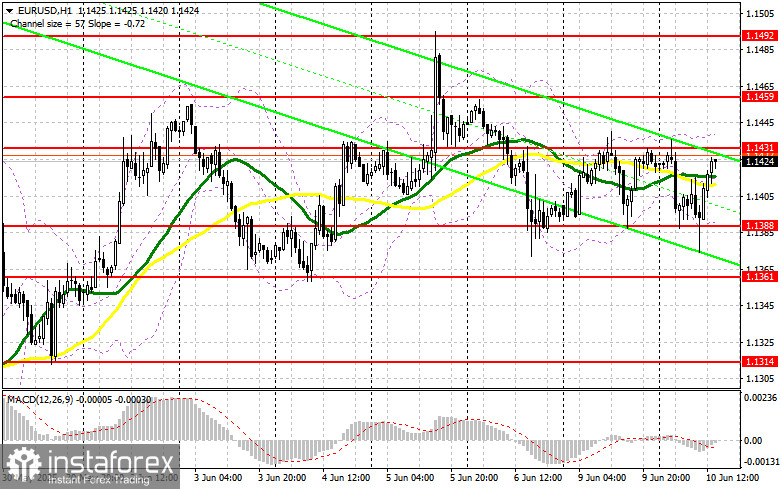
Moving AveragesTrading is occurring around the 30- and 50-period moving averages, signaling market indecision.Note: The moving averages are analyzed on the H1 chart and differ from standard daily moving averages on the D1 timeframe.
Bollinger BandsIn the event of a decline, the lower boundary of the indicator around 1.1388 will serve as support.
Indicator Descriptions:


