empty
19.05.2025 10:36 AM
Forecast for GBP/USD on May 19, 2025

On the hourly chart, the GBP/USD pair continued to move sideways on Friday, fluctuating between the levels of 1.3205 and 1.3344. Following a rejection from the resistance zone of 1.3344–1.3357, there's still a chance of a further decline toward the 100.0% Fibonacci level at 1.3205. However, on the 4-hour chart, sideways movement has been ongoing for over a month now. At this moment, neither the bulls nor the bears have the upper hand.

This image is no longer relevant

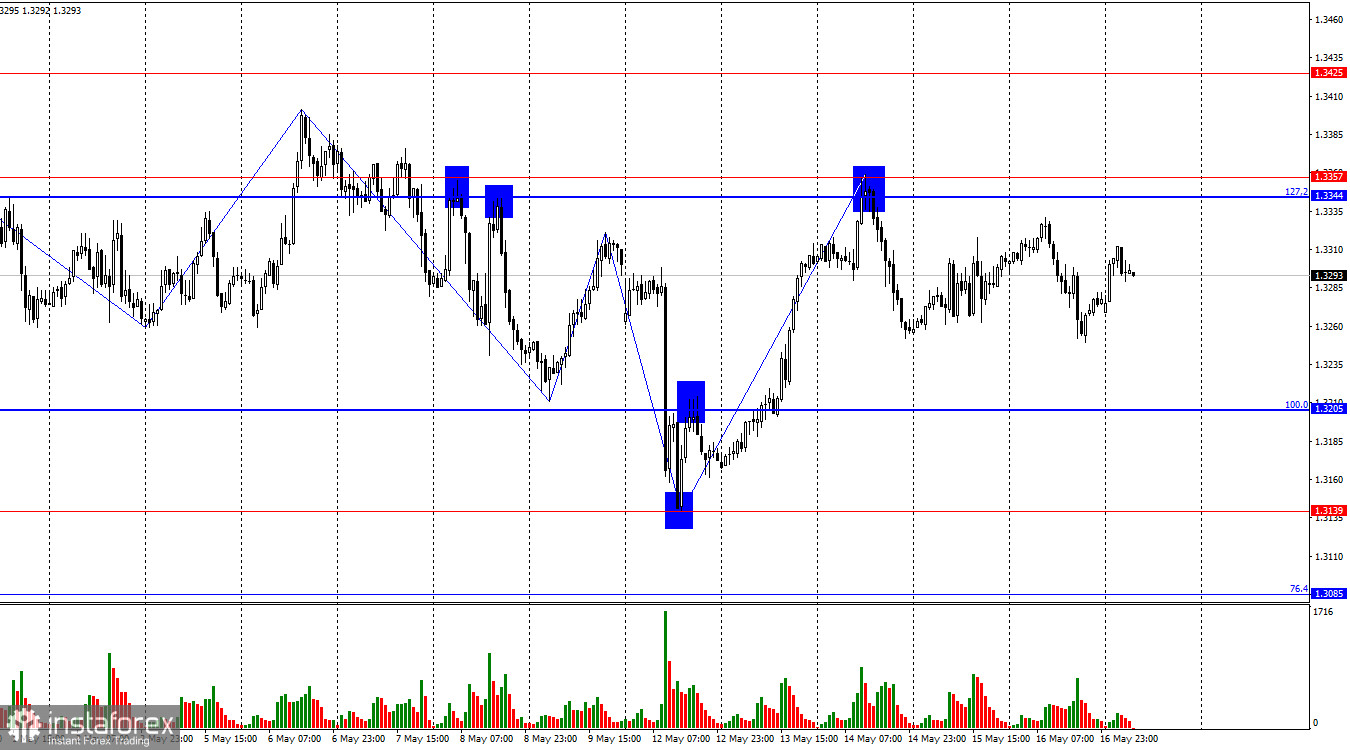
The wave scenario has become more complex after the latest bullish attack. The last completed upward wave broke above the previous peak, but the most recent downward wave also broke the prior low. This indicates a possible transition from a bearish trend to a bullish one. Bulls will have a hard time pushing above the 1.3425 level without new announcements from Donald Trump regarding increased or new import tariffs. Meanwhile, recent price action shows bears aren't having an easy time either. I believe the latest upward wave is more of a fluke, and the 1.3344–1.3357 zone will offer strong resistance.

On Friday, the UK had no economic data releases, while three reports came out in the U.S., none of which supported the bears. The bears made a brief push during the day, but bulls controlled the rest of the session. Overall, the pair remains range-bound. The sparse news flow had little impact on either the pound or the dollar. Trader sentiment is unlikely to change on Monday, as there are no scheduled economic releases. For the rest of the week, data will also be limited, and the pair has been trading sideways for a month. This means the only potential catalyst for traders may come from news on trade wars.

Let me remind you that out of Trump's three-month grace period on tariff rates, half the time has already passed. So within the next six weeks, either Trump will raise tariffs back to their original levels for nearly 80 countries (as currently, only one deal has been signed), or we'll see a flurry of new trade agreements. The first scenario favors the bears, the second the bulls.

This image is no longer relevant

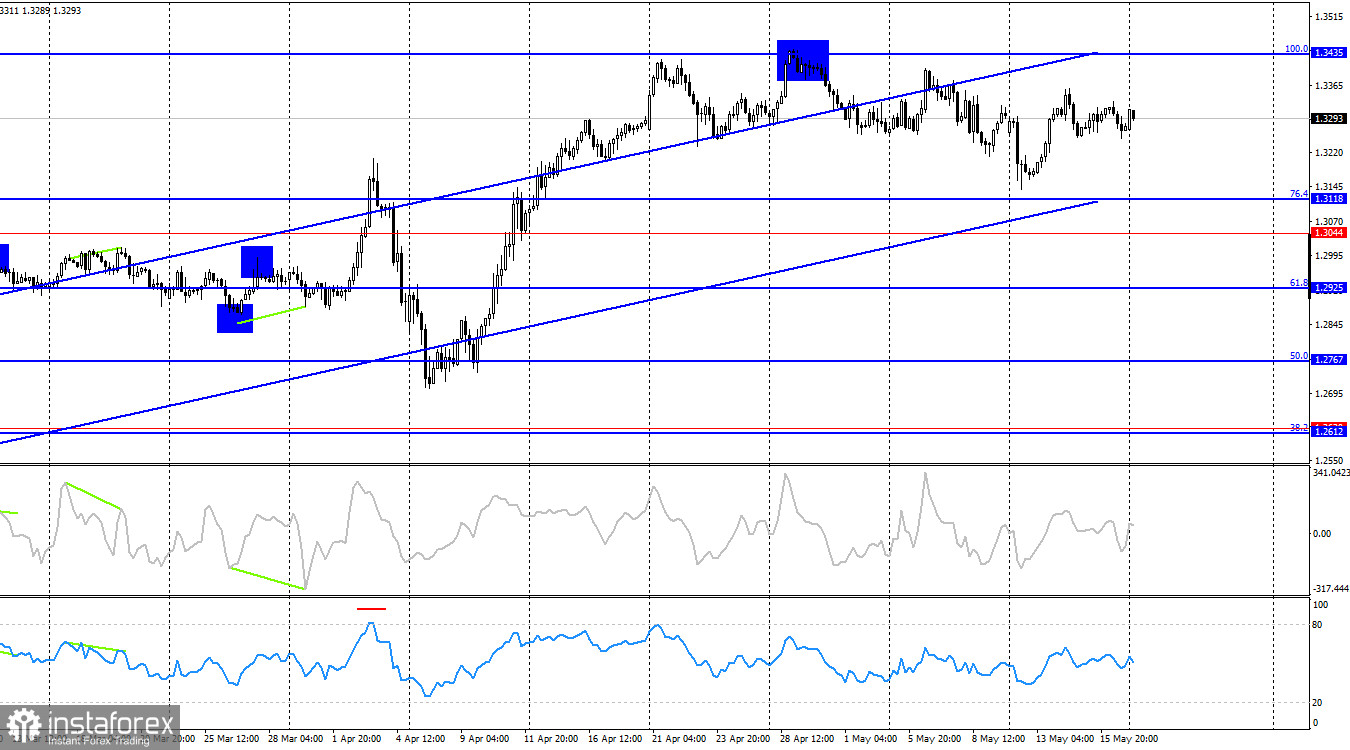
On the 4-hour chart, the pair has bounced off the 100.0% Fibonacci level at 1.3435 and turned in favor of the U.S. dollar, suggesting potential for a decline toward the 76.4% retracement level at 1.3118. However, in recent weeks we've seen more consolidation than downside momentum. No indicators are currently showing any signs of divergence. The ascending trend channel still points to a bullish trend. Only a firm break below the channel will indicate the possibility of a global reversal.

Commitments of Traders (COT) Report:

This image is no longer relevant

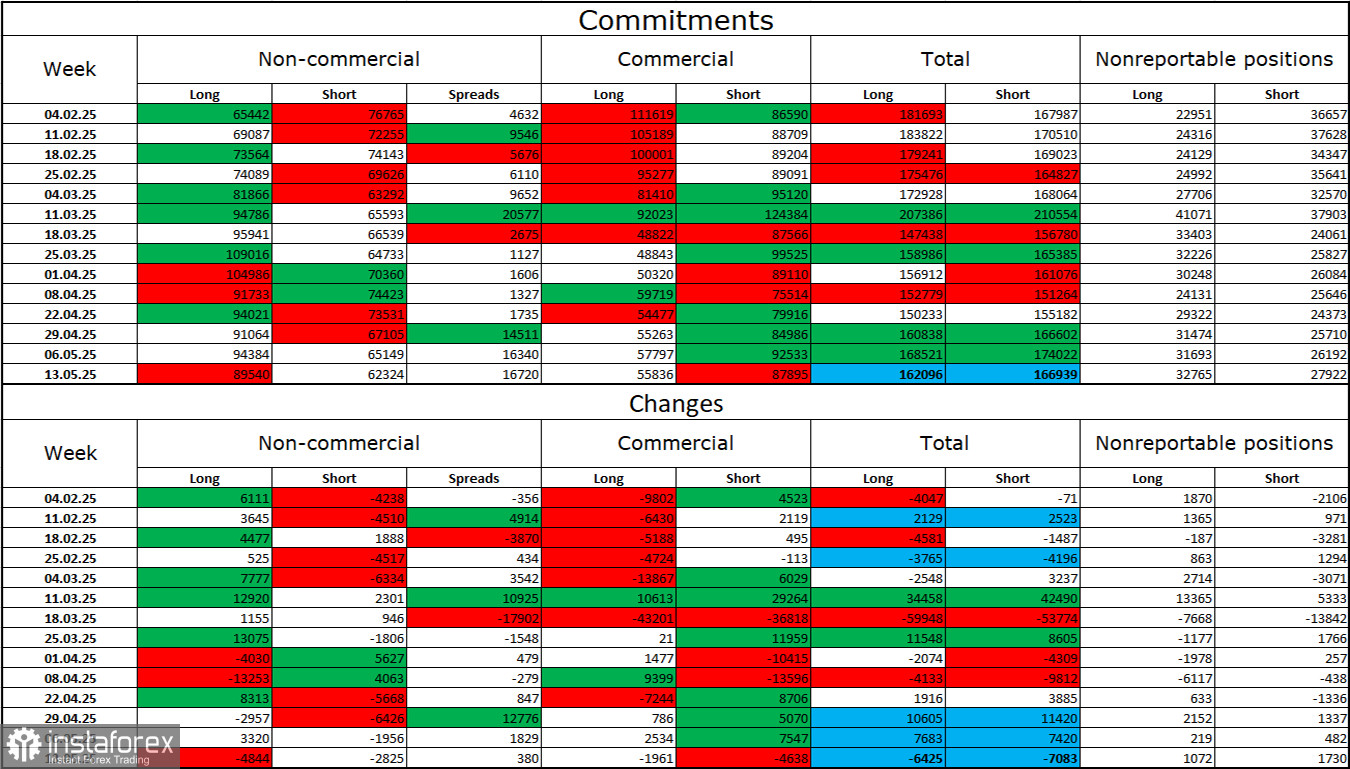
The sentiment among "Non-commercial" traders became slightly less bullish over the past reporting week. Long positions decreased by 4,844 contracts, while short positions declined by 2,825. Bears have long lost their market advantage. The gap between long and short positions now stands at 27,000 in favor of the bulls: 89,000 vs. 62,000.

In my opinion, the pound still faces downside risk, but recent developments could trigger a long-term market reversal. Over the past three months, long positions rose from 65,000 to 92,000, while short positions dropped from 76,000 to 62,000. Under Donald Trump, confidence in the U.S. dollar has weakened, and COT reports show that traders are reluctant to buy the greenback aggressively.

Economic Calendar for the U.S. and UK:

Monday: No scheduled economic events. The news backdrop is expected to have no effect on trader sentiment during the day.

GBP/USD Forecast and Trading Tips:

Selling the pair was possible after a rejection from the 1.3344–1.3357 zone on the hourly chart with targets at 1.3265 and 1.3205. Today, the same strategy applies: consider selling upon rejection from this resistance zone. Buying opportunities may be considered if the pair closes above 1.3344–1.3357 with a target of 1.3425.

Fibonacci grids are drawn from 1.3205 to 1.2695 on the hourly chart and from 1.3431 to 1.2104 on the 4-hour chart.

Samir Klishi,
Analytical expert of InstaTrade
© 2007-2025

Recommended Stories

Silver Forecast for June 5, 2025

After a strong move on June 2, the price formed a small triangular pattern over the following two days, with yesterday's candlestick closing at the opening level. This

Laurie Bailey 04:55 2025-06-05 UTC+2

GBP/JPY. Analysis and Forecast

The GBP/JPY pair continues to gain positive momentum for the second day in a row. From a technical standpoint, GBP/JPY has once again demonstrated resilience below the 200-day Simple Moving

Irina Yanina 14:05 2025-06-04 UTC+2

Forecast for EUR/USD on June 4, 2025

On Tuesday, the EUR/USD pair rebounded from the 76.4% retracement level at 1.1454, reversed in favor of the U.S. dollar, and began a downward move. Today, the pair consolidated below

Samir Klishi 14:02 2025-06-04 UTC+2

Forex forecast 04/06/2025: EUR/USD, GBP/USD, USD/CAD, Oil and Bitcoin

Useful links: My other articles are available in this section InstaForex course for beginners Popular Analytics Open trading account Important: The begginers in forex trading need to be very careful

Sebastian Seliga 12:05 2025-06-04 UTC+2

Forecast for GBP/USD on June 4, 2025

On the hourly chart, the GBP/USD pair showed no interest in movement on Tuesday. Throughout the day, bulls and bears launched weak attacks, none of which led to anything significant

Samir Klishi 10:05 2025-06-04 UTC+2

Technical Analysis of Intraday Price Movement of Silver Commodity Instrument, Wednesday June 04, 2025.

From what we can see on the 4-hour chart of the Silver commodity instrument, the Stochastic Oscillator indicator appears to be in Overbought condition so that in the near future

Arief Makmur 06:22 2025-06-04 UTC+2

Technical Analysis of Intraday Price Movement of AUD/JPY Cross Currency Pairs, Wednesday June 04, 2025.

Although on the 4-hour chart AUD/JPY has the potential to be corrected to weaken, which is confirmed by the condition of the Stochastic Oscillator indicator which is in an Overbought

Arief Makmur 06:22 2025-06-04 UTC+2

EUR/USD Forecast for June 4, 2025

Yesterday's inflation data from the Eurozone slightly slowed the euro's growth amid a continued stock market rally (Dow Jones +0.51%). However, considering the market's growth amid several challenges—including China's

Laurie Bailey 05:21 2025-06-04 UTC+2

GBP/USD Forecast for June 4, 2025

Yesterday, as the US dollar index strengthened by 0.53%, the British pound fell by 27 pips. However, this decline could already be offset during today's Asian session, as yesterday's

Laurie Bailey 05:21 2025-06-04 UTC+2

AUD/USD Forecast for June 4, 2025

The Australian dollar's move toward the price channel line at 0.6548 was delayed yesterday due to a "glitch" in the US dollar's downtrend (the index strengthened by 0.53%), but overall

Laurie Bailey 05:21 2025-06-04 UTC+2
Can't speak right now?
Ask your question in the chat.
 

Dear visitor,

Your IP address shows that you are currently located in the USA. If you are a resident of the United States, you are prohibited from using the services of InstaFintech Group including online trading, online transfers, deposit/withdrawal of funds, etc.

If you think you are seeing this message by mistake and your location is not the US, kindly proceed to the website. Otherwise, you must leave the website in order to comply with government restrictions.

Why does your IP address show your location as the USA?

  • - you are using a VPN provided by a hosting company based in the United States;
  • - your IP does not have proper WHOIS records;
  • - an error occurred in the WHOIS geolocation database.

Please confirm whether you are a US resident or not by clicking the relevant button below. If you choose the wrong option, being a US resident, you will not be able to open an account with InstaTrade anyway.

We are sorry for any inconvenience caused by this message.