See also

 02.05.2025 12:24 PM
Trade Analysis and Advice for the Japanese Yen
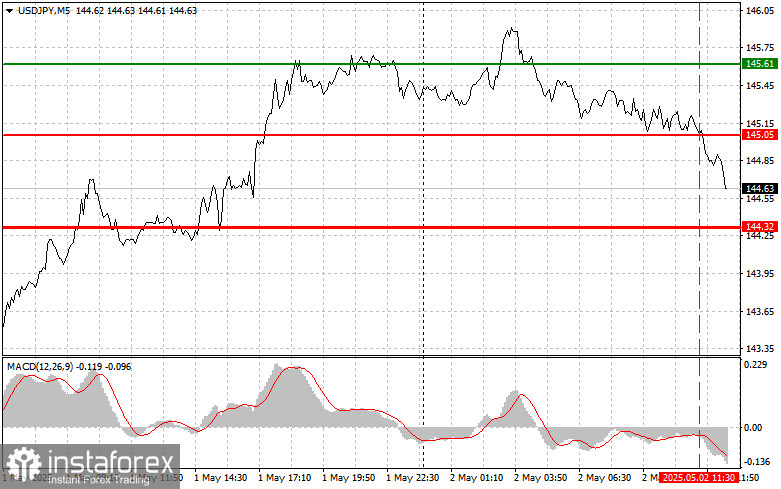
The test of the 145.05 level occurred when the MACD indicator had already moved significantly below the zero mark, which limited the dollar's downward potential. For this reason, I did not sell the dollar and missed the small move downward.
Upcoming U.S. data releases on nonfarm payrolls and the unemployment rate are expected shortly. These indicators are always closely watched by investors and experts, as they serve as crucial signals about the state of the U.S. economy and the likely direction of Federal Reserve monetary policy.
A negative change in nonfarm payrolls may indicate slowing economic development and the need for stimulus measures. If the unemployment rate rises simultaneously, the Federal Reserve will be left with no choice but to begin cutting interest rates, which could weaken the dollar's position against the yen. It is also important to pay attention to changes in average hourly earnings, which provide insight into wage dynamics. Rising wages, especially alongside job growth, can lead to increased consumer spending and inflation.
As for the intraday strategy, I will primarily rely on implementing Scenarios #1 and #2.
Buy Signal
Scenario #1: I plan to buy USD/JPY today at the entry point around 144.98 (green line on the chart), targeting a rise toward 146.14 (thicker green line on the chart). Around 146.14, I will exit long positions and open shorts in the opposite direction (expecting a 30–35 point reversal). A dollar rally today is only likely following strong U.S. data. Important! Before buying, make sure the MACD indicator is above the zero line and just beginning to rise from it.
Scenario #2: I also plan to buy USD/JPY today if there are two consecutive tests of the 144.45 level when the MACD indicator is in the oversold zone. This will limit the pair's downward potential and lead to a reversal upward. A rise to the opposing levels of 144.98 and 146.14 can be expected.
Sell Signal
Scenario #1: I plan to sell USD/JPY today after a break below 144.45 (red line on the chart), which will likely lead to a sharp drop in the pair. The key target for sellers will be 143.39, where I will exit short positions and immediately open long positions in the opposite direction (expecting a 20–25 point rebound from that level). Important! Before selling, make sure the MACD indicator is below the zero line and just beginning to decline from it.
Scenario #2: I also plan to sell USD/JPY today if there are two consecutive tests of the 144.98 level when the MACD indicator is in the overbought zone. This will limit the pair's upward potential and lead to a reversal downward. A drop to the opposing levels of 144.45 and 143.39 is expected.
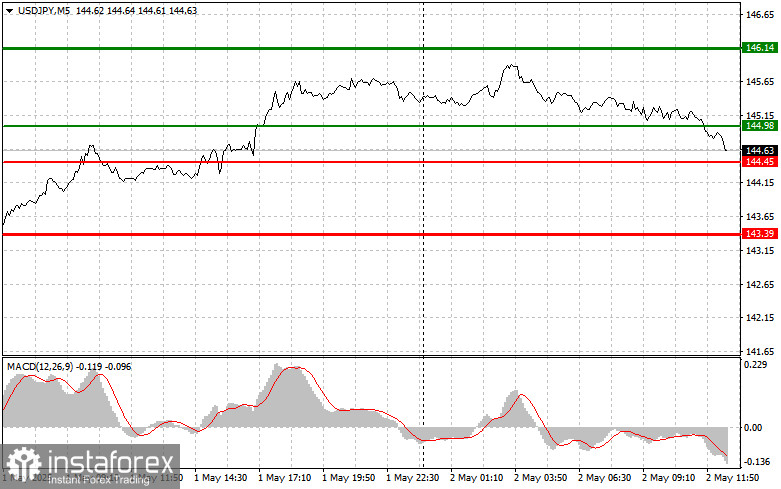
What's on the Chart:
Important Note
Beginner Forex traders must be extremely cautious when making entry decisions. Ahead of important fundamental reports, it's best to stay out of the market to avoid sharp price swings. If you choose to trade during news releases, always place stop-loss orders to minimize losses. Without stop-losses, you can lose your entire deposit very quickly—especially if you don't use proper money management and trade large volumes.
And remember, successful trading requires a clear trading plan like the one I've provided above. Spontaneous trading decisions based on current market conditions are initially a losing strategy for intraday traders.


