empty
28.04.2025 03:51 AM
USD/JPY – Summary and Prospects

This image is no longer relevant

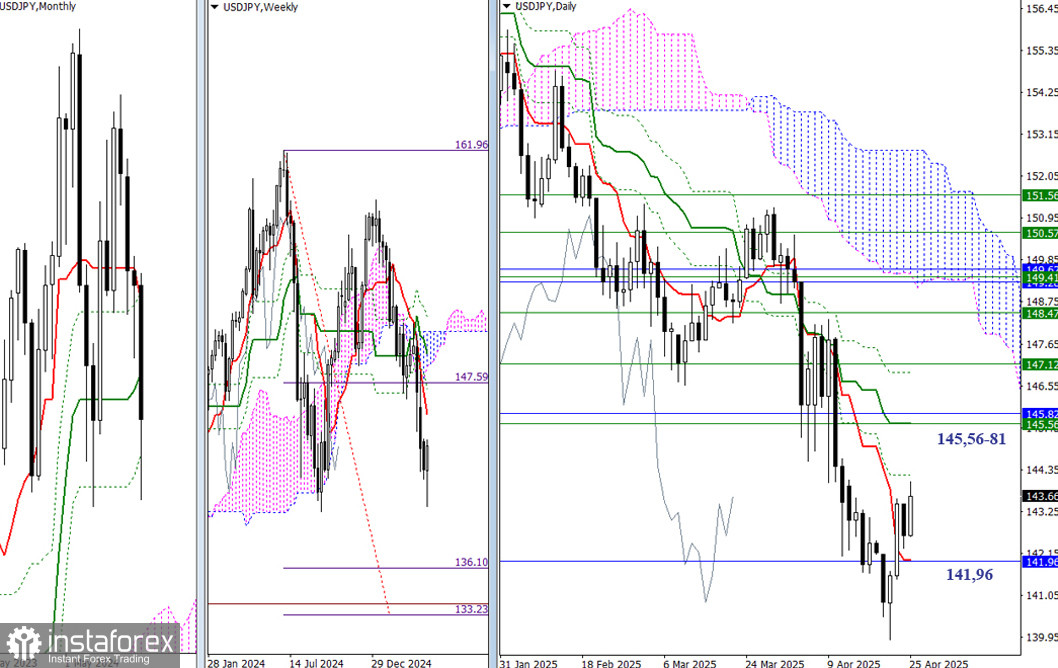
Last week, the market updated the low, but the sellers failed to continue the downward movement fully. This may have been because the previous week's low (141.63) was reinforced by the monthly support level (141.96). Consequently, the decline was halted, and the pair began showing upward correction. Thanks to this correction, the bulls reclaimed support from the daily short-term trend, which is currently located at 141.97, and continue pushing upward.

The nearest targets at the moment are the resistances of the daily Ichimoku cross (144.22 – 145.56), now reinforced by the weekly short-term trend (145.56) and the monthly medium-term trend (145.81). Overcoming these resistance levels will shift the market's focus towards new prospects.

If the corrective rise ends and the pair falls below the nearest support around 141.96 (the final level of the monthly Ichimoku cross + the daily Tenkan), it will pose new challenges for the sellers. The bears will need to restore the downtrend (139.90) and continue the decline toward the weekly targets for breaking through the cloud (133.23 – 136.10), reinforced by the upper boundary of the monthly cloud (133.88).

This image is no longer relevant

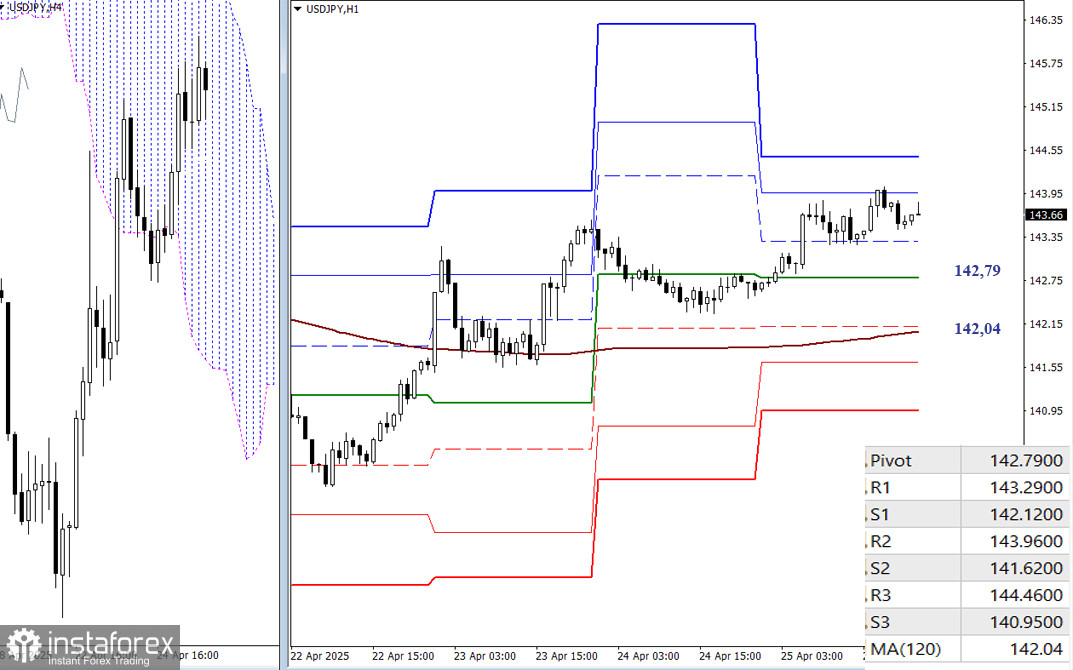
The buyers currently have the main advantage. The resistances of the classic pivot levels will be additional reference points for intraday growth development.

Upon completion of the rise, the nearest and most important reference points will be the supports of the key levels: 142.79 (the daily central Pivot level) and 142.04 (the weekly long-term trend). A breakthrough and reversal of the trend would transfer the main advantage to the sellers, thus supporting the further development of bearish sentiment. Reference points for the intraday decline are supports of the classic pivot levels. The actual Pivot values will be available at the market open and updated daily.

***

Technical Analysis Components:
  • Higher Timeframes: Ichimoku Kinko Hyo (9.26.52) and Fibonacci Kijun levels
  • H1: Classic Pivot Points and 120-period Moving Average (weekly long-term trend)
Evangelos Poulakis,
Analytical expert of InstaTrade
© 2007-2025

Recommended Stories

EUR/USD. July 4th. Bears continue to retreat from the market

On Thursday, the EUR/USD pair rebounded once again from the 1.1802 level and declined almost to the 127.2% Fibonacci retracement level at 1.1712. As of Friday morning, the pair

Samir Klishi 10:53 2025-07-04 UTC+2

Forex forecast 04/07/2025: EUR/USD, GBP/USD, USD/JPY, SP500 and Bitcoin

Useful links: My other articles are available in this section InstaForex course for beginners Popular Analytics Open trading account Important: The begginers in forex trading need to be very careful

Sebastian Seliga 10:51 2025-07-04 UTC+2

GBP/USD. July 4th. Independence Day

On the hourly chart, the GBP/USD pair on Thursday rebounded from the support zone of 1.3611–1.3633, reversed in favor of the pound, and now has every chance to continue rising

Samir Klishi 10:01 2025-07-04 UTC+2

EUR/USD Forecast for July 4, 2025

The main event of yesterday largely aligned with our forecasts — specifically, the anticipated "number play" occurred. But it was done very delicately, just enough to halt the growth

Laurie Bailey 06:01 2025-07-04 UTC+2

GBP/USD Forecast for July 4, 2025

On the daily chart, the British pound has consolidated below the MACD line. It had an excellent opportunity to also consolidate below the support level of 1.3635, but that attempt

Laurie Bailey 05:58 2025-07-04 UTC+2

Natural Gas Forecast for July 4, 2025

Natural Gas (NG) The daily balance indicator line decisively halted yesterday's price surge — Thursday ended with a decline of 2.63%. The drop, in turn, was held back

Laurie Bailey 05:53 2025-07-04 UTC+2

Trading Signals for BITCOIN for July 4-8, 2025: sell below $110,610 (7/8 Murray - 21 SMA)

On the other hand, if Bitcoin consolidates above the 7/8 Murray level, it is likely that it will reach the strong resistance of the 8/8 Murray level located at $112,500

Dimitrios Zappas 05:17 2025-07-04 UTC+2

Trading Signals for GOLD (XAU/USD) for July 4-8, 2025: sell below $3,350 (21 SMA - 3/8 Murray)

If gold recovers above the 200 EMA at 3,327, we could expect a pullback to 3,345. This area represents strong resistance and could be seen as a selling opportunity

Dimitrios Zappas 05:15 2025-07-04 UTC+2

Trading Signals for EUR/USD for July 4-8, 2025: sell below 1.1795 (21 SMA - 8/8 Murray)

The eagle indicator has been giving a negative signal since June 30, so our strategy will remain bearish. As long as the euro price trades below 1.1795, we continue

Dimitrios Zappas 05:13 2025-07-04 UTC+2

EUR/USD. July 3rd. The Most Important Day of the Week

On Wednesday, the EUR/USD pair rebounded from the 1.1802 level, reversed in favor of the U.S. dollar, and showed a slight decline. However, by Thursday morning, the pair had returned

Samir Klishi 12:10 2025-07-03 UTC+2
Can't speak right now?
Ask your question in the chat.
 

Dear visitor,

Your IP address shows that you are currently located in the USA. If you are a resident of the United States, you are prohibited from using the services of InstaFintech Group including online trading, online transfers, deposit/withdrawal of funds, etc.

If you think you are seeing this message by mistake and your location is not the US, kindly proceed to the website. Otherwise, you must leave the website in order to comply with government restrictions.

Why does your IP address show your location as the USA?

  • - you are using a VPN provided by a hosting company based in the United States;
  • - your IP does not have proper WHOIS records;
  • - an error occurred in the WHOIS geolocation database.

Please confirm whether you are a US resident or not by clicking the relevant button below. If you choose the wrong option, being a US resident, you will not be able to open an account with InstaTrade anyway.

We are sorry for any inconvenience caused by this message.