See also
On Thursday, the US Labor Department published a weekly update on unemployment benefits. The data turned out to be worse than analysts' expectations. The number of continued unemployment claims increased from 1,860 million to 1,905 million. Besides, the number of initial applications for benefits rose from 202K to 215K. Despite the signs of weakness in the labor market, the US dollar asserted its strength across the board. Perhaps the reason for the greenback's growth was expectations of a decline in inflation in the Eurozone. The inflation report will be available on Friday.
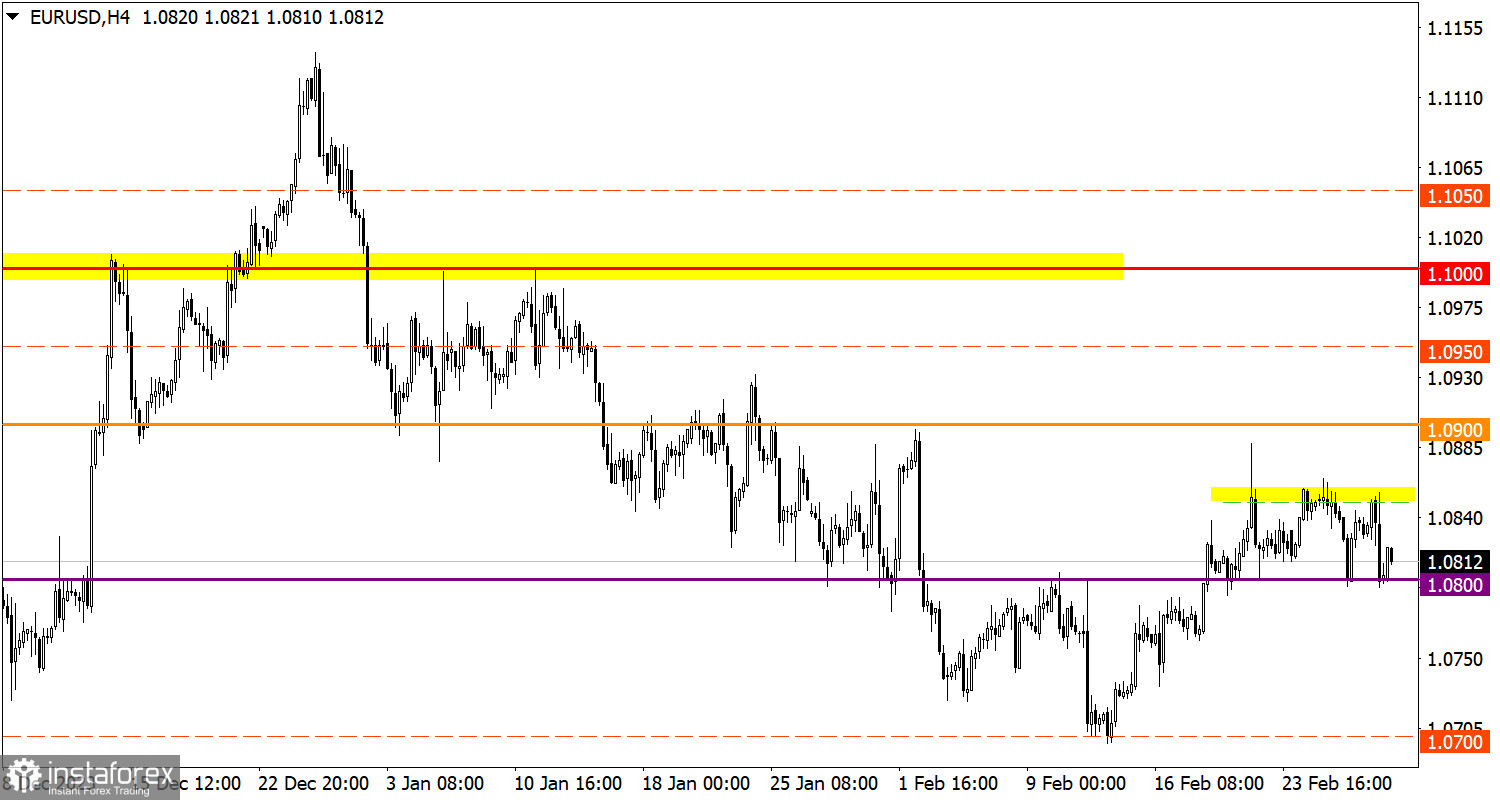
The EUR/USD pair again reached the level of 1.0800, where traders cut on short positions was observed. Judging by the speculative price swings, the instrument will soon quit the range between 1.0800 and 1.0850.
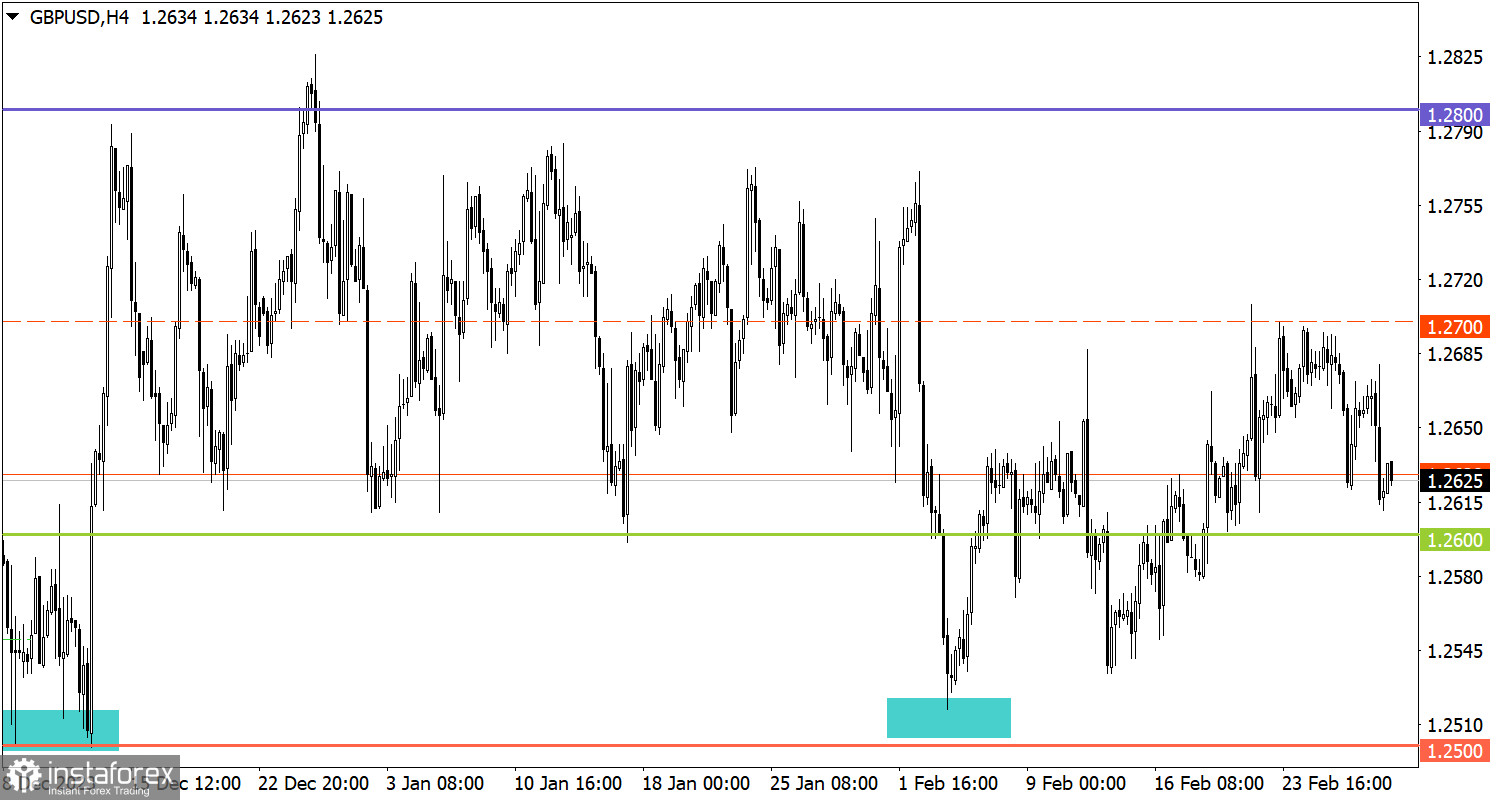
The GBP/USD pair has been following a downtrend from the resistance level of 1.2700. As a result, the instrument is approaching the support level of 1.2600.
Today, the preliminary inflation data for the EU will be released. The annual CPI is expected to slip to 2.5% in February from 2.8% in January. This may contribute to the US dollar's advance.
If EUR/USD settles below 1.0800, traders will add more short positions. Consequently, the instrument will trade lower. Until then, the realistic scenario is a climb to 1.0850.
To enable a further increase in short positions, GBP/USD needs to settle below 1.2600. Otherwise, this level will be viewed by traders as support. In turn, this will encourage a gradual recovery in the pound sterling.
The candlestick chart type consists of graphic rectangles in white and black with lines at the top and bottom. With a detailed analysis of each individual candle, you can see its characteristics relative to a particular time period: opening price, closing price, maximum and minimum price.
Horizontal levels are price coordinates relative to which a price may stop or revered its trajectory. In the market, these levels are called support and resistance.
Circles and rectangles are highlighted examples where the price developed. This color highlighting indicates horizontal lines that may put pressure on the price in the future.
Up/down arrows are guidelines for a possible direction in the future.
You have already liked this post today
*The market analysis posted here is meant to increase your awareness, but not to give instructions to make a trade.
On Thursday, the GBP/USD currency pair traded lower, which can be considered a local correction. This movement will cease to be a correction only if the price consolidates below
On Thursday, the EUR/USD currency pair exhibited astonishingly low volatility and a complete unwillingness to move in any clear direction. Many traders were expecting active movements during
Analysis of Wednesday's Trades 1H Chart of GBP/USD The GBP/USD pair also continued its upward movement on Wednesday. As expected, this happened without the need for any news or reports
Analysis of Wednesday's Trades 1H Chart of EUR/USD On Wednesday, the EUR/USD currency pair continued its upward movement. Essentially, we are seeing the same pattern every day this week —
Unlike the EUR/USD pair, the GBP/USD currency pair steadily continued its upward movement on Wednesday. There were no significant macroeconomic events in either the U.S. or the UK during
The EUR/USD currency pair showed no notable movements on Wednesday, and the market displayed no interest in Donald Trump's trade deals. As we've said repeatedly, what's the point of trade
Analysis of Tuesday's Trades 1H Chart of GBP/USD The GBP/USD pair also continued its upward movement on Tuesday. As expected, this did not require any news or reports. One could
Analysis of Tuesday's Trades 1H Chart of EUR/USD On Tuesday, the EUR/USD currency pair continued its upward movement, as expected. Recall that the day before, the price consolidated above
On Tuesday, the GBP/USD currency pair also continued its upward movement. While the new decline of the U.S. dollar could be attributed to Jerome Powell's speech—as the only major event
On Tuesday, the EUR/USD currency pair remained flat for the first half of the day and then moved higher in the second half. During the U.S. session, Jerome Powell delivered
Your IP address shows that you are currently located in the USA. If you are a resident of the United States, you are prohibited from using the services of InstaFintech Group including online trading, online transfers, deposit/withdrawal of funds, etc.
If you think you are seeing this message by mistake and your location is not the US, kindly proceed to the website. Otherwise, you must leave the website in order to comply with government restrictions.
Why does your IP address show your location as the USA?
Please confirm whether you are a US resident or not by clicking the relevant button below. If you choose the wrong option, being a US resident, you will not be able to open an account with InstaTrade anyway.
We are sorry for any inconvenience caused by this message.