empty
21.12.2023 01:20 PM
EUR/USD and GBP/USD: Trading plan for beginner traders on December 21, 2023

Details of the Economic Calendar on December 20

On Wednesday, inflation data for the United Kingdom was published, dropping to the September 2021 low. The Consumer Price Index fell from 4.6% to 3.9%, versus the expected 4.3%. Thus, the Bank of England is likely no longer able to avoid the question of reducing the interest rate. The reaction of the pound sterling was corresponding, which swiftly began to decline in value.

Analysis of Trading Charts from December 20

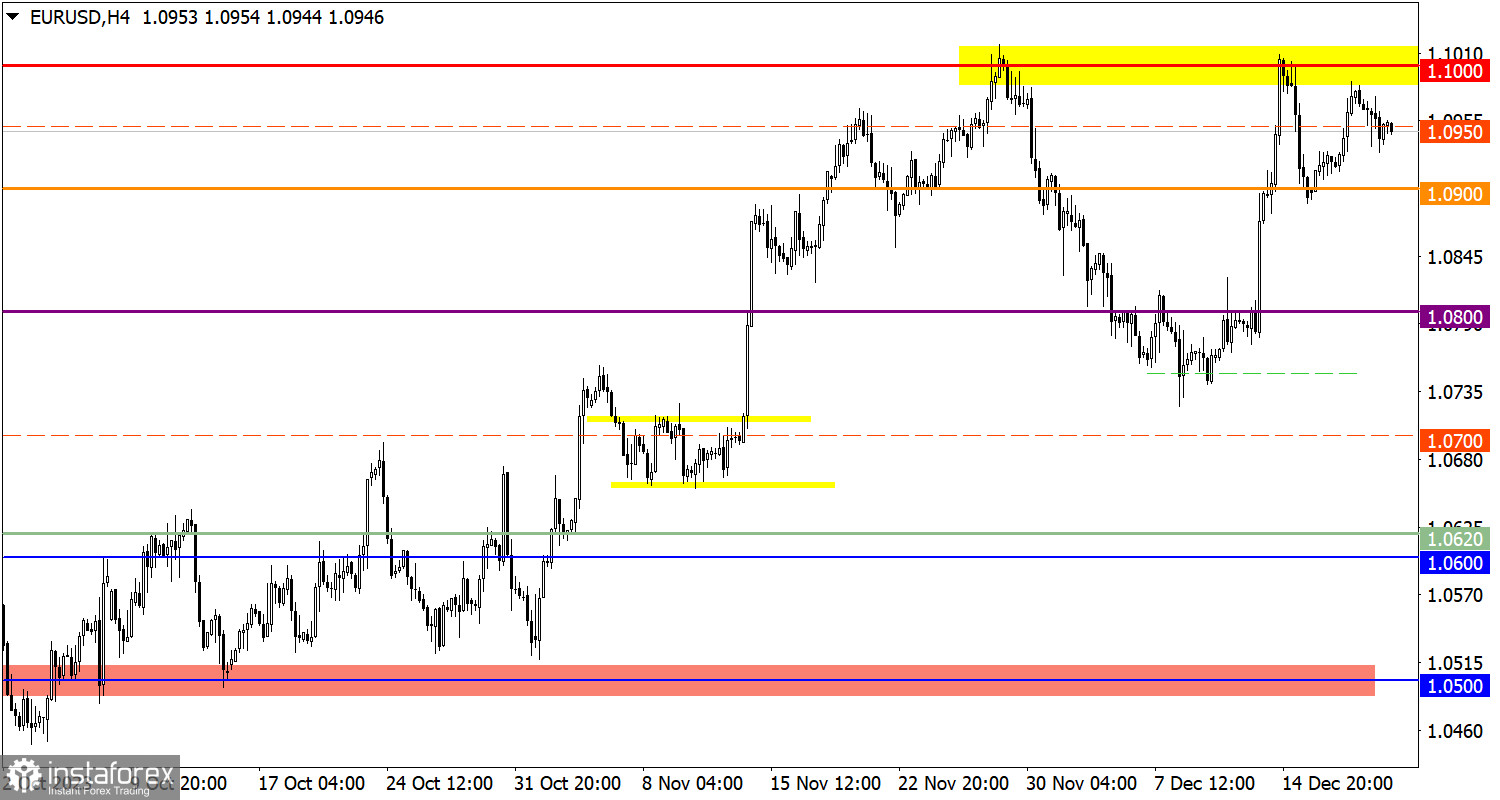
The EUR/USD currency pair reduced the volume of long positions near the 1.1000 mark. This move led to another rebound in price from the resistance level.

The GBP/USD pair traded in a downward trend, during which the quote managed to update the local low of the correction cycle.

This image is no longer relevant

Economic Calendar on December 21

Today, the publication of data on jobless claims in the United States is expected, where an overall increase in this indicator is predicted. Statistical data details indicate that the volume of continuing claims for benefits may rise from 1.876 million to 1.888 million, and the volume of initial claims may rise from 202,000 to 215,000.

Time Targeting:

U.S. jobless claims – 13:30 UTC

EUR/USD Trading Plan for December 21

With further decline, the quote may reach the level of 1.0900. To continue the upward trend, price stabilization above the level of 1.1000 is necessary.

This image is no longer relevant

GBP/USD Trading Plan for December 21

If the price stabilizes below 1.2600, this may lead to further depreciation of the pound sterling to the level of 1.2500.

As for the upward scenario, for its consideration, the quote needs to first rise above the level of 1.2700 with confirmation on the daily period.

This image is no longer relevant

What's on the charts

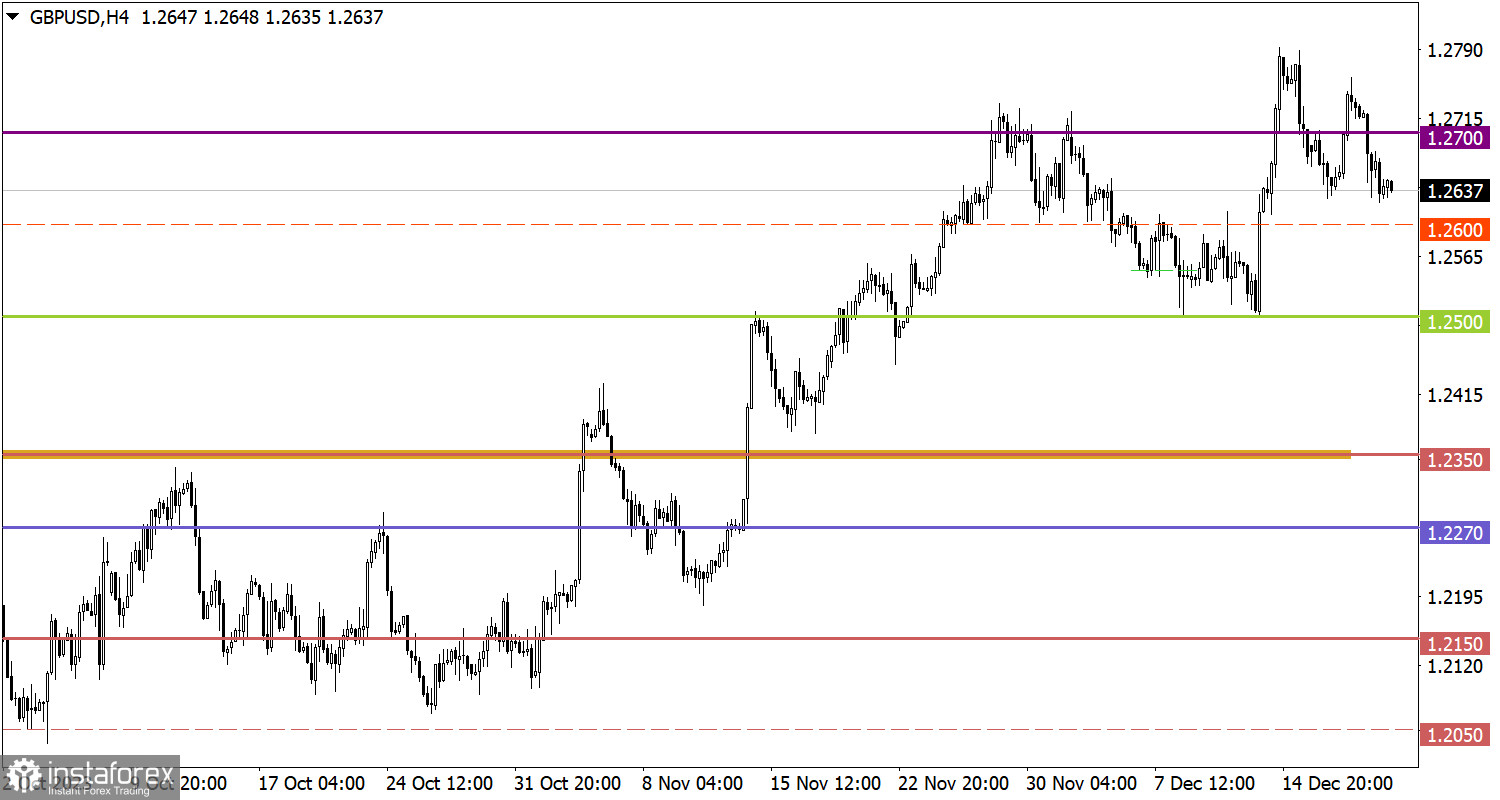
The candlestick chart type is white and black graphic rectangles with lines above and below. With a detailed analysis of each individual candle, you can see its characteristics relative to a particular time frame: opening price, closing price, intraday high and low.

Horizontal levels are price coordinates, relative to which a price may stop or reverse its trajectory. In the market, these levels are called support and resistance.

Circles and rectangles are highlighted examples where the price reversed in history. This color highlighting indicates horizontal lines that may put pressure on the asset's price in the future.

The up/down arrows are landmarks of the possible price direction in the future.

Gven Podolsky,
Analytical expert of InstaTrade
© 2007-2025

Recommended Stories

How to Trade the GBP/USD Currency Pair on July 8TH? Simple Tips and Trade Analysis for Beginners

Monday Trade Analysis: GBP/USD 1H chart On Monday, the GBP/USD pair was clearly trading sideways. On the hourly timeframe, it consolidated below the ascending trendline, but in our view, this

Paolo Greco 10:45 2025-07-08 UTC+2

How to Trade the EUR/USD Currency Pair on July 8th: Simple Tips and Trade Review for Beginners

Monday Trade Review: EUR/USD, 1H Chart On Monday, the EUR/USD pair traded with a downward bias, and the U.S. dollar posted a fairly strong gain. As we've mentioned before, even

Paolo Greco 10:09 2025-07-08 UTC+2

Trading Recommendations and Trade Analysis for GBP/USD on July 8th

The GBP/USD currency pair also declined on Monday. However, on its uncertain downward path, the pair encountered the Senkou Span B line of the Ichimoku indicator for the third time—and

Paolo Greco 07:42 2025-07-08 UTC+2

Trading Recommendations and Trade Analysis for EUR/USD on July 8th

The EUR/USD pair traded with a downward bias on Monday, even though there were no fundamental reasons supporting the dollar's strength. However, the dollar's rise was weak, which is especially

Paolo Greco 06:51 2025-07-08 UTC+2

GBP/USD: Trading Plan for the U.S. Session on July 7th (Review of Morning Trades)

In my morning forecast, I highlighted the 1.3602 level and planned to use it to determine entry points into the market. Let's look at the 5-minute chart and analyze what

Miroslaw Bawulski 13:21 2025-07-07 UTC+2

EUR/USD: Trading Plan for the U.S. Session on July 7th (Review of the Morning Trades)

In my morning forecast, I highlighted the 1.1749 level and planned to base market entry decisions around it. Let's look at the 5-minute chart and break down what happened

Miroslaw Bawulski 13:20 2025-07-07 UTC+2

How to Trade the GBP/USD Currency Pair on July 7th? Simple Tips and Trade Review for Beginners

On Friday, the GBP/USD pair showed total flat movement and low volatility. As with the EUR/USD pair, there was no news that day, and no macroeconomic publications were released either

Paolo Greco 07:48 2025-07-07 UTC+2

How to Trade the EUR/USD Currency Pair on July 7th: Simple Tips and Trade Analysis for Beginners

Friday Trade Analysis: EUR/USD 1H Chart The EUR/USD pair stayed flat all day Friday, with volatility totaling 36 points, clearly indicating a lack of trading activity. This is not surprising

Paolo Greco 07:32 2025-07-07 UTC+2

GBP/USD Trading Recommendations and Trade Analysis for July 7th

The GBP/USD currency pair traded with low volatility and primarily moved sideways. As mentioned earlier, last week was particularly interesting in how the market interpreted various events and publications

Paolo Greco 07:11 2025-07-07 UTC+2

EUR/USD Trading Recommendations and Trade Analysis for July 7th

The EUR/USD currency pair did not exhibit any notable movements on Friday—or any movements at all. Friday was Independence Day in the United States, effectively making it a non-trading

Paolo Greco 07:03 2025-07-07 UTC+2
Can't speak right now?
Ask your question in the chat.
 

Dear visitor,

Your IP address shows that you are currently located in the USA. If you are a resident of the United States, you are prohibited from using the services of InstaFintech Group including online trading, online transfers, deposit/withdrawal of funds, etc.

If you think you are seeing this message by mistake and your location is not the US, kindly proceed to the website. Otherwise, you must leave the website in order to comply with government restrictions.

Why does your IP address show your location as the USA?

  • - you are using a VPN provided by a hosting company based in the United States;
  • - your IP does not have proper WHOIS records;
  • - an error occurred in the WHOIS geolocation database.

Please confirm whether you are a US resident or not by clicking the relevant button below. If you choose the wrong option, being a US resident, you will not be able to open an account with InstaTrade anyway.

We are sorry for any inconvenience caused by this message.