empty
31.10.2023 06:32 AM
EUR/USD and GBP/USD: Technical analysis for October 31

EUR/USD

This image is no longer relevant

Higher Timeframes

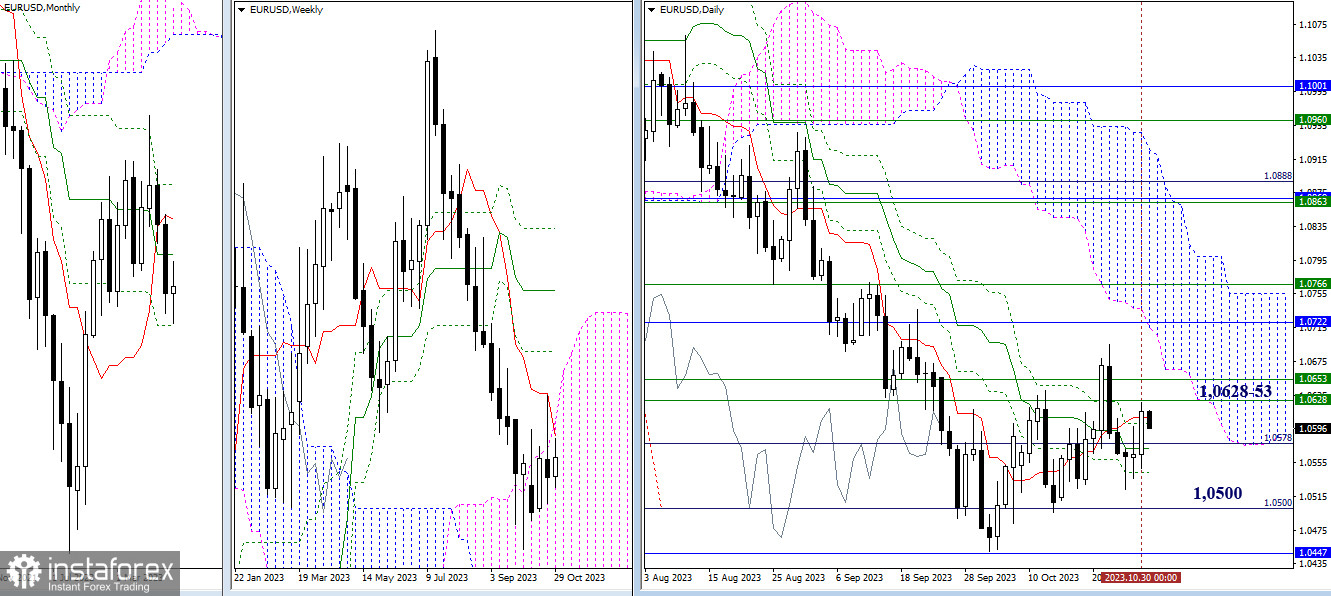
At the end of yesterday, judging by the mood and the shape of the daily candle, it can be said that the advantage during the day belonged to the bullish players. However, one day did not fundamentally change the situation. The main conclusions and expectations remain the same. For the bulls, it is now important to overcome the weekly resistances at 1.0628 – 1.0653 (weekly short-term trend + upper boundary of the weekly cloud). Next, attention will be on updating the high (1.0695) and testing the area of 1.0716-22 (lower boundary of the daily cloud + monthly medium-term trend). The current support and influence on the situation at the moment are provided by the levels of the daily Ichimoku cross (1.0609 – 1.0601 – 1.0572 – 1.0543). The subsequent bearish targets today retain their significance and are located at 1.0500 (daily target level) and 1.0447 (final level of the monthly Ichimoku cross).

This image is no longer relevant

H4 – H1

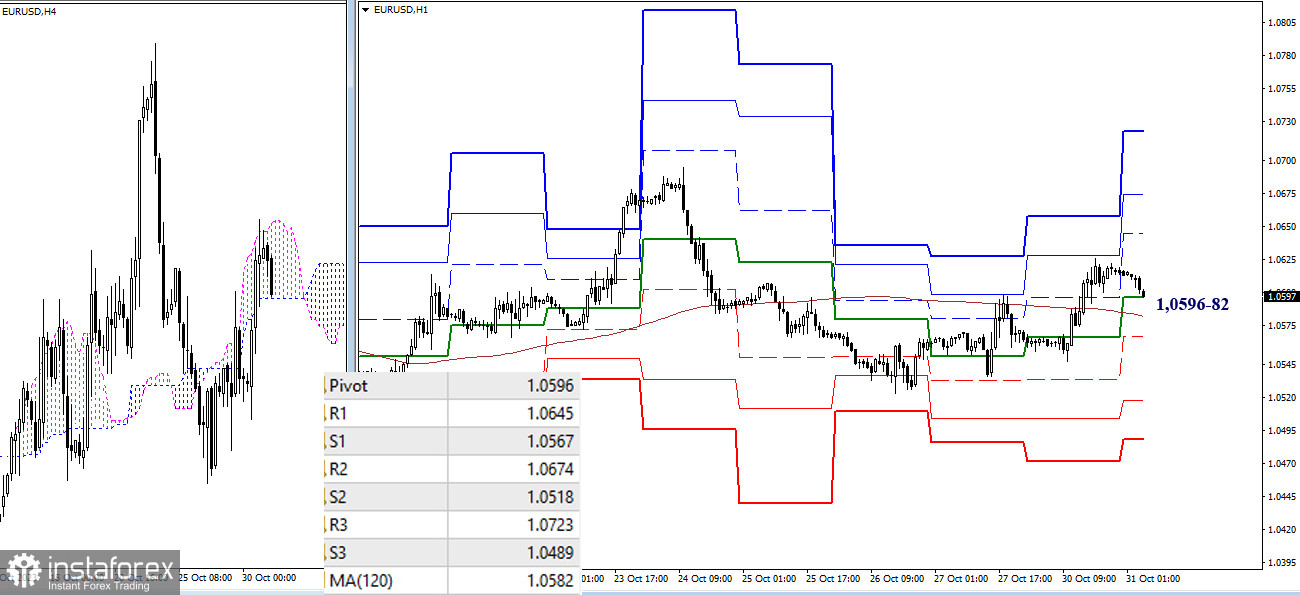
On the lower timeframes, bulls rose above the key levels, turning them into supports. However, they have not been able to reverse the movement yet. In case of further ascent, the next bullish targets within the day can be noted at 1.0645 – 1.0674 – 1.0723 (resistances of classic pivot points). A change in sentiment can happen very quickly now; it is enough for the bears to drop below the key levels located today at 1.0596 – 1.0582 (central pivot point + weekly long-term trend). The next intraday bearish targets are at 1.0567 – 1.0518 – 1.0489 (supports of classic pivot points).

***

GBP/USD

This image is no longer relevant

Higher Timeframes

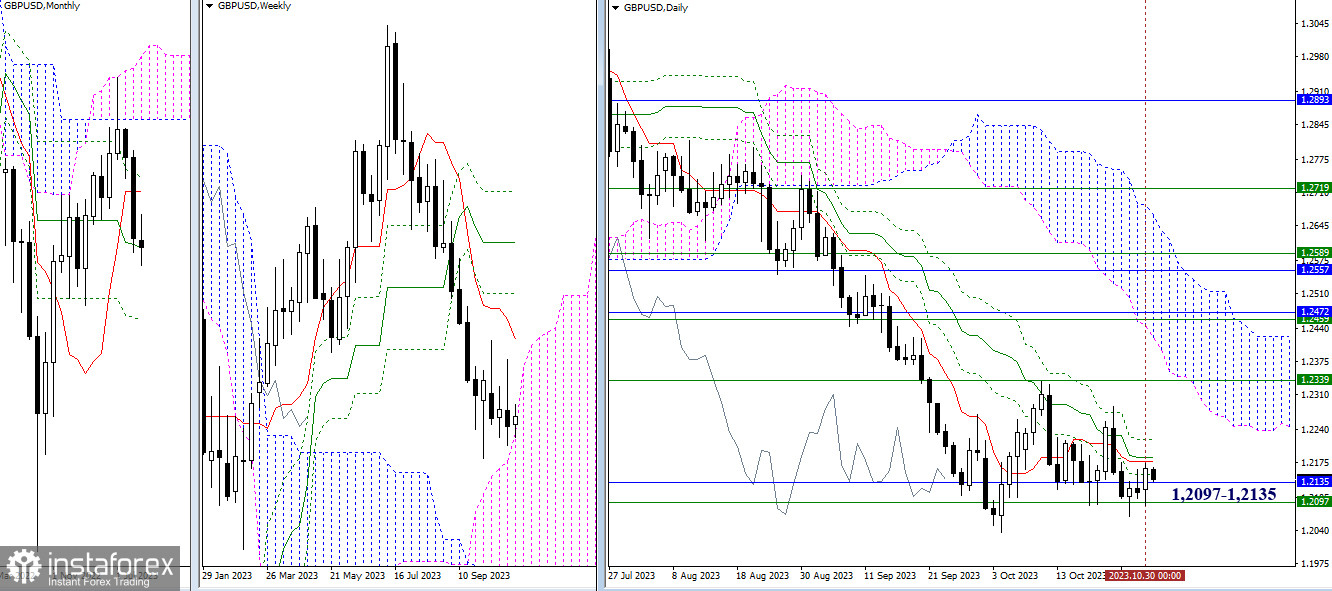
The pound continues to be influenced by the force of attraction of two significant levels in the area of 1.2097 – 1.2135 (upper boundary of the weekly cloud + monthly medium-term trend). Bearish players need an exit from the current zone of attraction and a reliable reversal of the downward trend through the update of the low (1.2036). For the bulls, it is important to eliminate the daily cross (1.2151 – 1.2178 – 1.2186 – 1.2221) and consolidate above the weekly short-term trend (1.2339).

This image is no longer relevant

H4 – H1

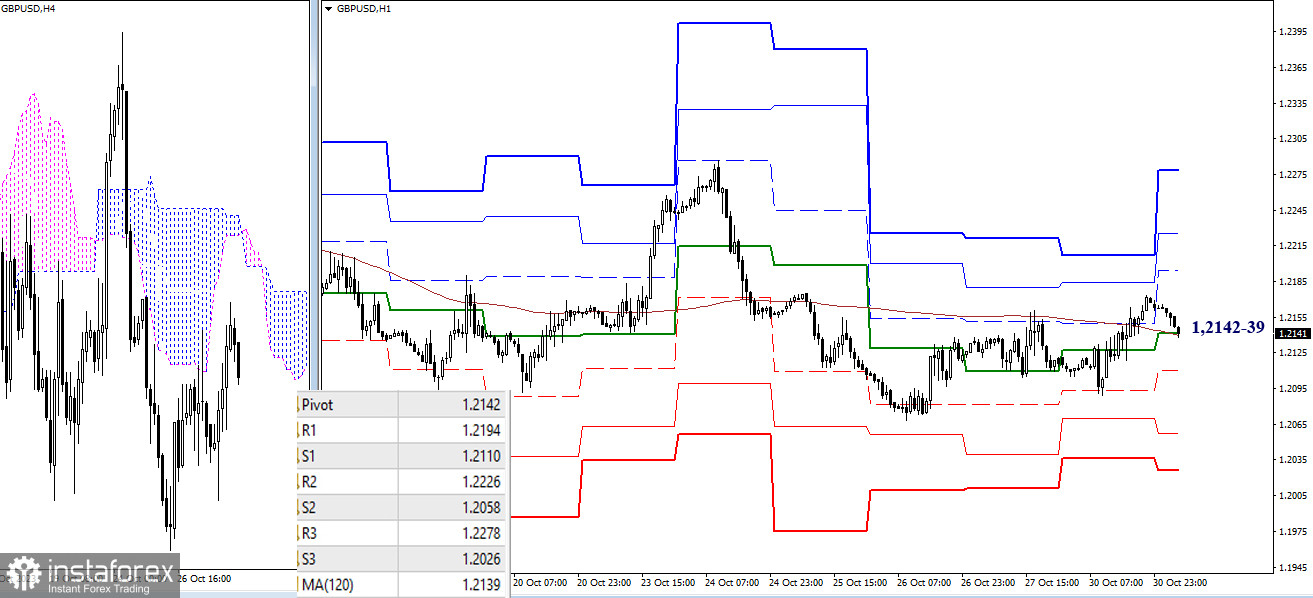
On the lower timeframes, the key levels today have come together in the area of 1.2139 – 1.2142 (weekly long-term trend + central pivot point of the day). Interacting with the key levels, the market seems to be in a point of balance and uncertainty. Trading above the key levels gives the advantage to strengthening bullish sentiments. The resistances of classic pivot points (1.2194 – 1.2296 – 1.2278) can serve as targets for the development of an intraday rise. Trading below the key levels may create conditions for bearish activity and a decline. Intraday bearish targets are at the support levels of classic pivot points (1.2110 – 1.2058 – 1.2026).

***

The technical analysis of the situation uses:

Higher timeframes - Ichimoku Kinko Hyo (9.26.52) + Fibo Kijun levels

Lower timeframes - H1 - Pivot Points (classic) + Moving Average 120 (weekly long-term trend)

Evangelos Poulakis,
Analytical expert of InstaTrade
© 2007-2025

Recommended Stories

Forecast for EUR/USD on July 11, 2025

On Thursday, the EUR/USD pair continued its decline toward the 1.1645 level, while the 127.2% Fibonacci corrective level at 1.1712 was largely ignored by traders. A rebound from 1.1645 would

Samir Klishi 12:44 2025-07-11 UTC+2

Forecast for GBP/USD on July 11, 2025

On the hourly chart, the GBP/USD pair on Thursday rebounded from the resistance zone of 1.3611–1.3633 and resumed its decline toward the 127.2% Fibonacci level at 1.3527. A rebound from

Samir Klishi 12:20 2025-07-11 UTC+2

Despite the potential for a correction, gold still has the potential to strengthen today, Friday, July 11, 2025.

XAU/USD, Friday, July 11, 2025. Although it appears to have corrected due to being held at Resistance 1, the continued strength of XAU/USD's technical and fundamental conditions provides an opportunity

Arief Makmur 08:00 2025-07-11 UTC+2

EUR/USD Forecast for July 11, 2025

EUR/USD On the weekly chart, we observe a set of reversal signals: divergence, a trend shift in the Fibonacci time zone, and a price rebound from the intersection

Laurie Bailey 07:09 2025-07-11 UTC+2

GBP/USD Forecast for July 11, 2025

GBP/USD On the monthly chart, the British pound reversed from the 161.8% Fibonacci reaction level, calculated from the upper boundary of the global 18-year price channel, immediately after

Laurie Bailey 06:46 2025-07-11 UTC+2

USD/CAD Forecast for July 11, 2025

USD/CAD The Canadian dollar had been consolidating for three days before today's upward breakout during the Pacific session. The price has already pierced the balance line with its upper shadow

Laurie Bailey 06:42 2025-07-11 UTC+2

Forecast for EUR/USD on July 10, 2025

On Wednesday, the EUR/USD pair continued to move along a trajectory known only to itself. The 127.2% Fibonacci correction level at 1.1712 was once again ignored by traders. I still

Samir Klishi 12:21 2025-07-10 UTC+2

Forecast for GBP/USD on July 10, 2025

On the hourly chart, the GBP/USD pair continued its upward movement on Wednesday after rebounding from the 127.2% Fibonacci corrective level at 1.3527. The rebound was precise, leading

Samir Klishi 10:35 2025-07-10 UTC+2

GBP/JPY. Analysis, Forecast, and Current Market Situation

On Thursday, the GBP/JPY pair is regaining upward momentum and shows readiness for further growth. The formation of an ascending channel confirms the stability of the bullish trend. During

Irina Yanina 10:22 2025-07-10 UTC+2

If the resistance level of 0.7964 holds back its upward movement, USD/CHF has the potential to weaken on Thursday, July 10, 2025.

USD/CHF, Thursday, July 10, 2025 In addition to rumors of a planned Fed interest rate cut and falling US government bond yields, USD/CHF weakened today. Key Levels 1. Resistance

Arief Makmur 06:47 2025-07-10 UTC+2
Can't speak right now?
Ask your question in the chat.
 

Dear visitor,

Your IP address shows that you are currently located in the USA. If you are a resident of the United States, you are prohibited from using the services of InstaFintech Group including online trading, online transfers, deposit/withdrawal of funds, etc.

If you think you are seeing this message by mistake and your location is not the US, kindly proceed to the website. Otherwise, you must leave the website in order to comply with government restrictions.

Why does your IP address show your location as the USA?

  • - you are using a VPN provided by a hosting company based in the United States;
  • - your IP does not have proper WHOIS records;
  • - an error occurred in the WHOIS geolocation database.

Please confirm whether you are a US resident or not by clicking the relevant button below. If you choose the wrong option, being a US resident, you will not be able to open an account with InstaTrade anyway.

We are sorry for any inconvenience caused by this message.