See also


 15.06.2022 10:42 AM
Today will be the first of the two most important events on the economic calendar this week for the GBP/USD currency pair. Of course, this will be the US Federal Reserve (Fed) interest rate decision this evening, followed by Fed Chairman Jerome Powell's press conference. Notably, experts predict that the Fed will announce a 50 basis point increase in the federal funds rate this evening. With the US dollar having strengthened strongly against its main competitors over the last three trading days, this could be the case today immediately after the announcement of the Fed's interest rate decision and Powell's comments. Given the strong appreciation of the US dollar before the announcement of the FOMC decision, one would assume that the market has already took a lead from this event.
Thus, based on the 50bp rate hike expected and already incorporated into the USD price, the US dollar may be sold, against the background of profit taking. Notably, this is exactly what happened after the previous two Fed Funds rate increases. Prior to the decisions themselves the US dollar strengthened and upon the announcement of the expected rate hikes it was sold off. This practice is used quite often by market participants. Before turning to the GBP/USD price charts, I would like to point out that today's Fed decision event is not the end for the GBP/USD pair. The second part will be the Bank of England's interest rate decision tomorrow. It is expected to rise by 25 basis points.
Daily
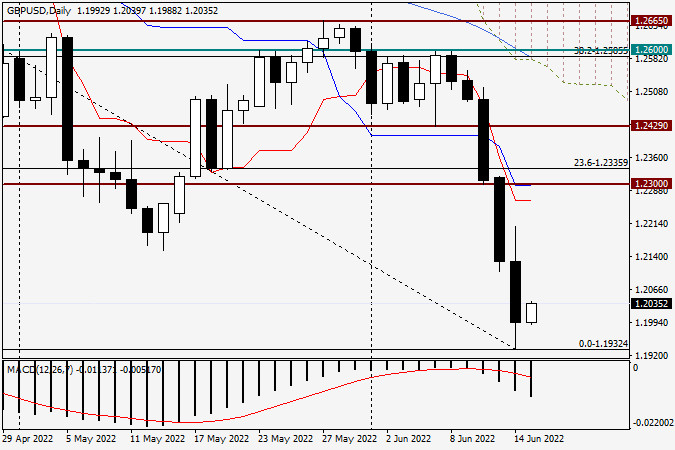
So, in yesterday's trading GBP/USD continued its downward trend and finished the trading on June 14 at 1.1993. The closing price of yesterday's session is marked to draw your attention to the factor of yesterday's close under the milestone psychological, historical and technical level of 1.2000. It is premature to make definitive conclusions about a true breakdown based on a single closed candle above or below a level. Therefore, today's and tomorrow's trading on GBP/USD becomes extremely important. As can be seen, the pair is climbing. This increase should be considered as a correction.
H4
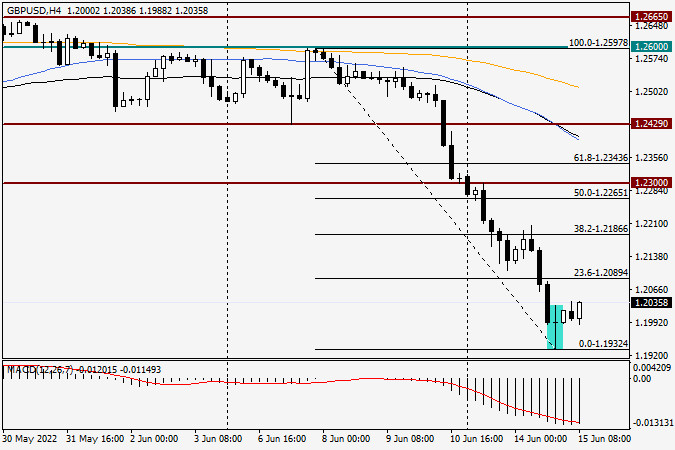
Looking at the four-hour chart, one should pay attention to the highlighted doji candlestick, which has very long shadows. This candlestick can be classified as a Long-Legged Doji reversal candlestick pattern. The question is whether it will eventually do so and whether the market will materialize it. Nevertheless, we cannot ignore the obvious technical factors, including important points related to candlestick analysis. Of course, this pattern would be much more significant and powerful if it appeared on one of the higher timeframes, especially on the weekly one. At this point, given the Fibonacci grid stretched into the 1.2597-1.1932 drop, we can expect a rate correction, at least to the first pullback level from this 23.6 Fibonacci move.
If such a pullback does occur, I recommend to monitor the pair's behaviour very closely near this Fibonacci level. A reversal from there would likely signal a continuation of the downside scenario and confirm yesterday's lows at 1.1932. In case it passes 23.6 Fibonacci level upwards and consolidates above it, we should expect a deeper corrective pullback, e.g. towards 1.2200 or even towards the strong technical mark at 1.2300. I am not going to offer clear trading recommendations so as not to mislead you. Tomorrow we will analyze the market's reaction to today's rate decision of the Fed, and also we will see what changes occurred in the technical picture of GBP/USD. I would not be surprised if the pound reverses up from 1.2000.
You have already liked this post today
*The market analysis posted here is meant to increase your awareness, but not to give instructions to make a trade.
On Tuesday, the EUR/USD pair continued its downward movement and closed below the 100.0% Fibonacci retracement level at 1.1574. This suggests that the decline may continue on Wednesday, targeting
Useful links: My other articles are available in this section InstaForex course for beginners Popular Analytics Open trading account Important: The begginers in forex trading need to be very careful
Gold is trading around 3,332, recovering after having reached the key level of $3,300. Gold is expected to climb to the 7/8 Murray level around 3,398 in the coming days
Technically, the euro is reaching oversold levels. So, the odds are that there will be consolidation above the psychological level of 1.15 or above 6/8 Murray in the coming days
If Bitcoin breaks the downtrend channel in the next few days and consolidates above $119,000, we could expect it to reach the 7/8 Murray level around 121,875 and even
USD/CHF – Wednesday, July 30, 2025. The appearance of divergence between the USD/CHF price movement and the RSI(14) indicator indicates the potential for a limited correction. Although the RSI(14)
AUD/USD – Wednesday, July 30, 2025. With the RSI (14) condition in the neutral-bullish area, even though the EMA (50) is below the EMA (200), sellers are still quite dominant
InstaTrade video
analytics
Daily analytical reviews
InstaTrade
video analytics

Your IP address shows that you are currently located in the USA. If you are a resident of the United States, you are prohibited from using the services of InstaFintech Group including online trading, online transfers, deposit/withdrawal of funds, etc.
If you think you are seeing this message by mistake and your location is not the US, kindly proceed to the website. Otherwise, you must leave the website in order to comply with government restrictions.
Why does your IP address show your location as the USA?
Please confirm whether you are a US resident or not by clicking the relevant button below. If you choose the wrong option, being a US resident, you will not be able to open an account with InstaTrade anyway.
We are sorry for any inconvenience caused by this message.


