empty
18.05.2022 04:21 PM
EUR/USD Price Analysis for May 18, 2022

This image is no longer relevant

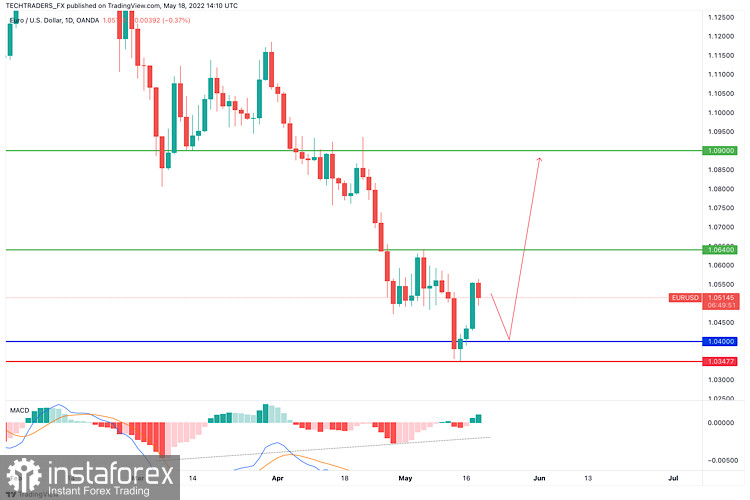
EUR/USD continues to fluctuate in negative territory above 1.0500 as the risk-averse market environment helps the dollar stay resilient against its rivals. The data from the US showed that Housing Starts contracted by 0.2% in April but investors showed no reaction to this figure.

The daily chart for the EUR/USD pair suggests that the corrective recovery could be complete. The pair is retreating from a firmly bearish 20 SMA, while technical indicators have lost their bullish strength. The Momentum is currently hovering around its midline, while the RSI has already resumed its decline and now hovers around 42.

In the near term and according to the 4-hour chart, the risk remains skewed to the upside. The pair trades around 1.0520, just below a bearish 100 SMA, but still holding above a bullish 20 SMA. Technical indicators, in the meantime, have resumed their advances within positive levels after correcting overbought conditions. Further gains are likely on a break above 1.0575, the immediate resistance level.

Support levels: 1.0510 1.0470 1.0430

Resistance levels: 1.0575 1.0620 1.0660

Jan Novotny,
Analytical expert of InstaTrade
© 2007-2025

Recommended Stories

Forex forecast 23/06/2025: EUR/USD, GBP/USD, USDX, Oil, Ethereum and Bitcoin

Useful links: My other articles are available in this section InstaForex course for beginners Popular Analytics Open trading account Important: The begginers in forex trading need to be very careful

Sebastian Seliga 12:08 2025-06-23 UTC+2

Technical Analysis for the Week of June 23–28: GBP/USD Currency Pair

Last week, the pair moved downward and tested the 14.6% pullback level at 1.3392 (red dashed line), after which the price rebounded and closed the weekly candle at 1.3446

Stefan Doll 11:38 2025-06-23 UTC+2

Technical Analysis for the Week of June 23–28: EUR/USD Currency Pair

Last week, the pair moved downward and tested the 76.4% pullback level at 1.1452 (red dashed line), after which the price rebounded and closed the weekly candle at 1.1520

Stefan Doll 11:31 2025-06-23 UTC+2

Forecast for EUR/USD on June 23, 2025

On Friday, the EUR/USD pair continued to rise after rebounding from the 76.4% corrective level at 1.1454. However, on Monday night, the pair returned to this level. A new rebound

Samir Klishi 11:24 2025-06-23 UTC+2

Forecast for GBP/USD on June 23, 2025

On the hourly chart, the GBP/USD pair on Friday consolidated below the support zone of 1.3425–1.3444, once again allowing for the expectation of a continued decline toward the support level

Samir Klishi 11:19 2025-06-23 UTC+2

Technical Analysis of Daily Price Movement of USD/IDR Exotic Currency Pairs, Monday June 23, 2025.

16473.27 Currently on the Daily chart, the Exotic USD/IDR currency pair has a Bullish 123 pattern which indicates that USD/IDR is currently strengthening, where this is also confirmed

Arief Makmur 07:29 2025-06-23 UTC+2

Technical Analysis of Intraday Price Movement of Crude Oil Commodity Instrument, Monday June 23, 2025.

In addition to the appearance of Divergence between the price movement of Crude Oil and the Stochastic Oscillator indicator on the 4-hour chart, there is also a Bearish 123 pattern

Arief Makmur 07:29 2025-06-23 UTC+2

EUR/USD Forecast for June 23, 2025

A bearish divergence has formed on the weekly chart for the euro. We are preparing for a reversal into a long-term downward trend, but divergences with a gap often unfold

Laurie Bailey 05:00 2025-06-23 UTC+2

GBP/USD Forecast for June 23, 2025

The British pound opened the new week with a downward gap, which still preserves bullish optimism. There remains potential for the price to return above the resistance level at 1.3433

Laurie Bailey 04:56 2025-06-23 UTC+2

Oil Forecast for June 23, 2025

On the weekly chart, the signal line of the Marlin oscillator has begun to reverse from the 9.3600 level. Historically, this level has marked significant downward reversals—in April 2023, October

Laurie Bailey 04:56 2025-06-23 UTC+2
Can't speak right now?
Ask your question in the chat.
 

Dear visitor,

Your IP address shows that you are currently located in the USA. If you are a resident of the United States, you are prohibited from using the services of InstaFintech Group including online trading, online transfers, deposit/withdrawal of funds, etc.

If you think you are seeing this message by mistake and your location is not the US, kindly proceed to the website. Otherwise, you must leave the website in order to comply with government restrictions.

Why does your IP address show your location as the USA?

  • - you are using a VPN provided by a hosting company based in the United States;
  • - your IP does not have proper WHOIS records;
  • - an error occurred in the WHOIS geolocation database.

Please confirm whether you are a US resident or not by clicking the relevant button below. If you choose the wrong option, being a US resident, you will not be able to open an account with InstaTrade anyway.

We are sorry for any inconvenience caused by this message.