Bullish Rectangle
was formed on 03.06 at 23:47:07 (UTC+0)
signal strength 1 of 5
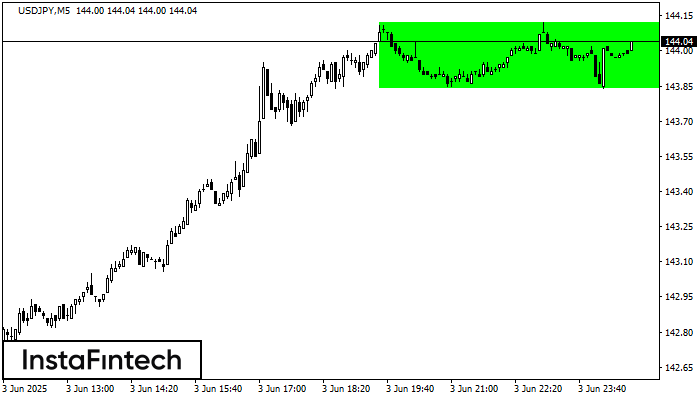
According to the chart of M5, USDJPY formed the Bullish Rectangle. This type of a pattern indicates a trend continuation. It consists of two levels: resistance 144.12 and support 143.84. In case the resistance level 144.12 - 144.12 is broken, the instrument is likely to follow the bullish trend.
The M5 and M15 time frames may have more false entry points.
See Also
- All
- All
- Bearish Rectangle
- Bearish Symmetrical Triangle
- Bullish Rectangle
- Double Top
- Double Top
- Triple Bottom
- Triple Bottom
- Triple Top
- Triple Top
- All
- All
- Buy
- Sale
- All
- 1
- 2
- 3
- 4
- 5
Triângulo Simétrico de Alta
was formed on 19.08 at 04:12:01 (UTC+0)
signal strength 1 of 5
De acordo com o gráfico de M5, NZDCAD formou o padrão de Triângulo Simétrico de Alta, sinalizando que a tendência continuará. Descrição: O limite superior do padrão toca as coordenadas
Os intervalos M5 e M15 podem ter mais pontos de entrada falsos.
Open chart in a new window
Topo duplo
was formed on 19.08 at 04:00:21 (UTC+0)
signal strength 4 of 5
O padrão de reversão Topo duplo foi formado em NZDJPY H1. Características: o limite superior 87.66; o limite inferior 87.41; a largura do padrão é de 24 pontos. As operações
Open chart in a new window
Triângulo Simétrico de Baixa
was formed on 19.08 at 03:55:59 (UTC+0)
signal strength 1 of 5
De acordo com o gráfico de M5, NZDCAD formou o padrão Triângulo Simétrico de Baixa. Descrição: o limite inferior é 0.8164/0.8175 e o limite superior é 0.8190/0.8175. A largura
Os intervalos M5 e M15 podem ter mais pontos de entrada falsos.
Open chart in a new window