Bullish Symmetrical Triangle
was formed on 06.06 at 14:26:12 (UTC+0)
signal strength 4 of 5
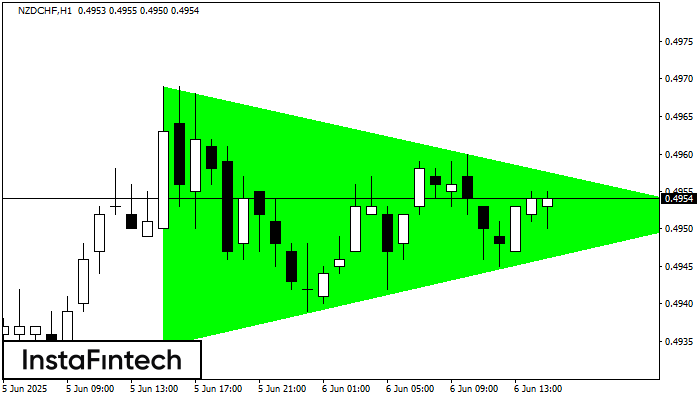
According to the chart of H1, NZDCHF formed the Bullish Symmetrical Triangle pattern. Description: This is the pattern of a trend continuation. 0.4969 and 0.4935 are the coordinates of the upper and lower borders respectively. The pattern width is measured on the chart at 34 pips. Outlook: If the upper border 0.4969 is broken, the price is likely to continue its move by 0.4992.
- All
- All
- Bearish Rectangle
- Bearish Symmetrical Triangle
- Bullish Rectangle
- Double Top
- Double Top
- Triple Bottom
- Triple Bottom
- Triple Top
- Triple Top
- All
- All
- Buy
- Sale
- All
- 1
- 2
- 3
- 4
- 5
डबल टॉप
was formed on 08.07 at 18:35:27 (UTC+0)
signal strength 1 of 5
#TSLA M5 पर डबल टॉप रीवर्सल पैटर्न बना है। विशेषताएं: ऊपरी सीमा 302.87; निचली सीमा 300.59; पैटर्न की चौड़ाई 214 पॉइंट्स है। सेल ट्रेडों को 300.59 की निचली सीमा के
M5 और M15 समय सीमा में अधिक फाल्स एंट्री पॉइंट्स हो सकते हैं।
Open chart in a new window
बियरिश पताका
was formed on 07.07 at 16:30:34 (UTC+0)
signal strength 1 of 5
बियरिश पताका पैटर्न #TSLA M5 चार्ट पर बना है। यदि पताका का 288.55 निम्न स्तर टूट जाता है, तो पैटर्न डाउनट्रेंड के जारी रहने का संकेत देता है। अनुशंसाएं: पैटर्न
M5 और M15 समय सीमा में अधिक फाल्स एंट्री पॉइंट्स हो सकते हैं।
Open chart in a new window
बियरिश पताका
was formed on 07.07 at 16:30:03 (UTC+0)
signal strength 1 of 5
बियरिश पताका पैटर्न #TSLA M5 चार्ट पर बना है। यदि पताका का 288.55 निम्न स्तर टूट जाता है, तो पैटर्न डाउनट्रेंड के जारी रहने का संकेत देता है। अनुशंसाएं: पैटर्न
M5 और M15 समय सीमा में अधिक फाल्स एंट्री पॉइंट्स हो सकते हैं।
Open chart in a new window