Triple Top
was formed on 03.06 at 00:30:20 (UTC+0)
signal strength 3 of 5
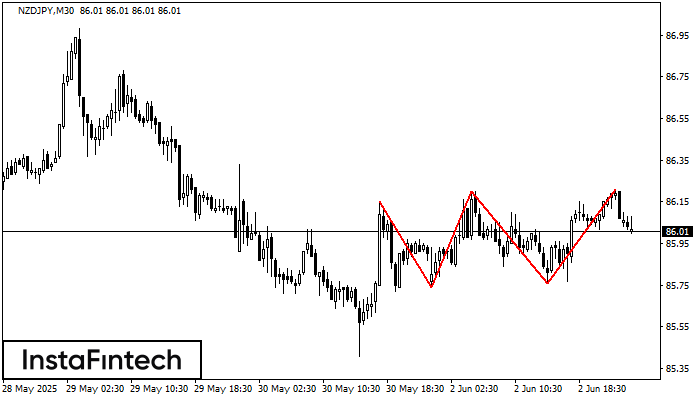
The Triple Top pattern has formed on the chart of the NZDJPY M30. Features of the pattern: borders have an ascending angle; the lower line of the pattern has the coordinates 85.74/85.76 with the upper limit 86.15/86.21; the projection of the width is 41 points. The formation of the Triple Top figure most likely indicates a change in the trend from upward to downward. This means that in the event of a breakdown of the support level of 85.74, the price is most likely to continue the downward movement.
Xem thêm
- All
- All
- Bearish Rectangle
- Bearish Symmetrical Triangle
- Bullish Rectangle
- Double Top
- Double Top
- Triple Bottom
- Triple Bottom
- Triple Top
- Triple Top
- All
- All
- Buy
- Sale
- All
- 1
- 2
- 3
- 4
- 5
Đỉnh đôi
was formed on 29.07 at 13:05:39 (UTC+0)
signal strength 1 of 5
Trên biểu đồ GBPJPY M5, mô hình đảo chiều Đỉnh đôi đã được hình thành. Đặc điểm: ranh giới trên ở 198.42; ranh giới dưới ở 198.21; chiều rộng
Khung thời gian M5 và M15 có thể có nhiều điểm vào lệnh sai hơn.
Open chart in a new window
Đảo đầu và vai
was formed on 29.07 at 12:30:36 (UTC+0)
signal strength 3 of 5
Theo M30, GBPAUD đang định hình mô hình kỹ thuật - Đảo đầu và vai. Trong trường hợp Đường viền cổ 2.0496/2.0502 bị phá vỡ, công
Open chart in a new window
Đỉnh đôi
was formed on 29.07 at 12:30:07 (UTC+0)
signal strength 3 of 5
Mô hình Đỉnh đôi đã được hình thành trên AUDCHF M30. Nó báo hiệu rằng xu hướng đã được thay đổi từ hướng lên thành hướng xuống
Open chart in a new window