Xem thêm

 02.02.2024 09:20 AM
Trend analysis (Fig. 1).
The GBP/USD currency pair may move upward from the level of 1.2739 (closing of yesterday's daily candle) to 1.2756, the 85.4% pullback level (blue dotted line). In the case of testing this level, a downward movement is possible with a target of 1.2733, the historical support level (blue dotted line). From this level, the upward trend may resume.
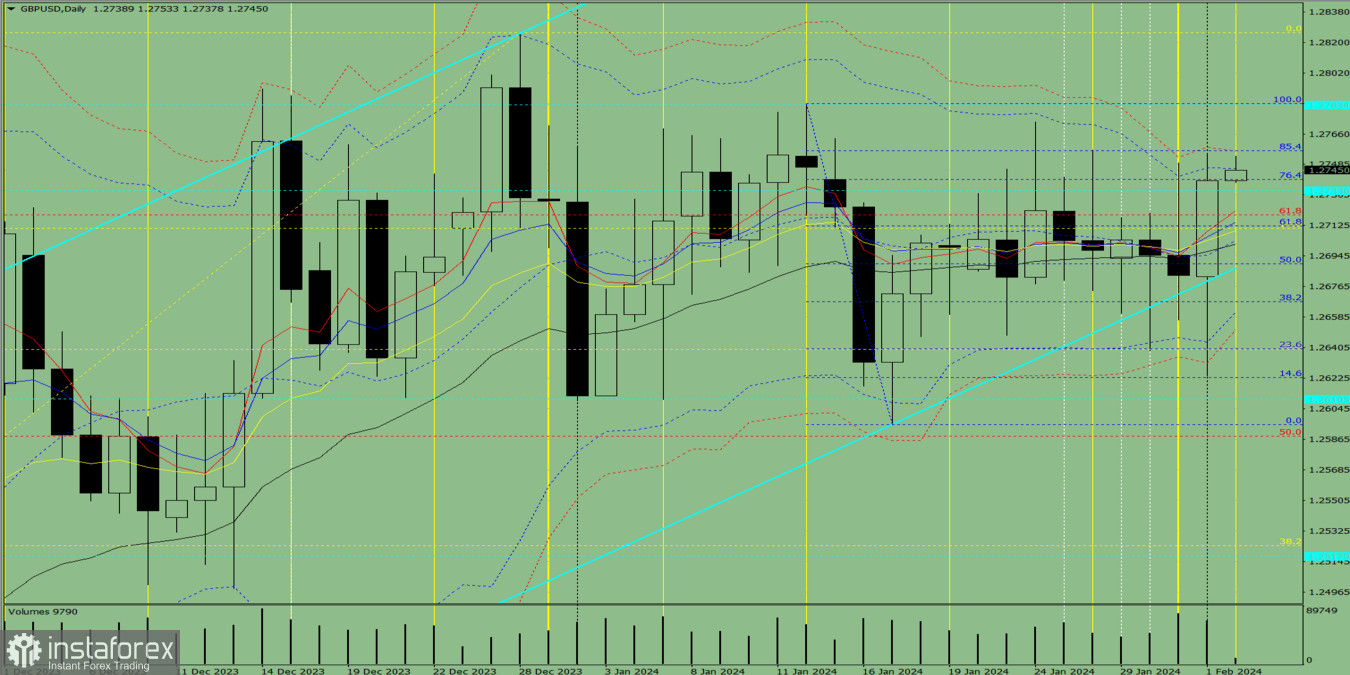
Fig. 1 (daily chart).
Comprehensive analysis:
General conclusion: Today, the price may move upward from the level of 1.2739 (closing of yesterday's daily candle) to 1.2756, the 85.4% pullback level (blue dotted line). In the case of testing this level, a downward movement is possible with a target of 1.2733, the historical support level (blue dotted line). From this level, the upward trend may resume.
Alternatively, the price may move upward from the level of 1.2739 (closing of yesterday's daily candlestick) to 1.2756, the 85.4% pullback level (blue dotted line). In the case of testing this level, a continued upward movement is possible.
You have already liked this post today
*Phân tích thị trường được đăng tải ở đây có nghĩa là để gia tăng nhận thức của bạn, nhưng không đưa ra các chỉ dẫn để thực hiện một giao dịch.

