empty
06.11.2023 06:29 AM
BITCOIN: Technical analysis of the situation

Bitcoin

This image is no longer relevant

Higher timeframes

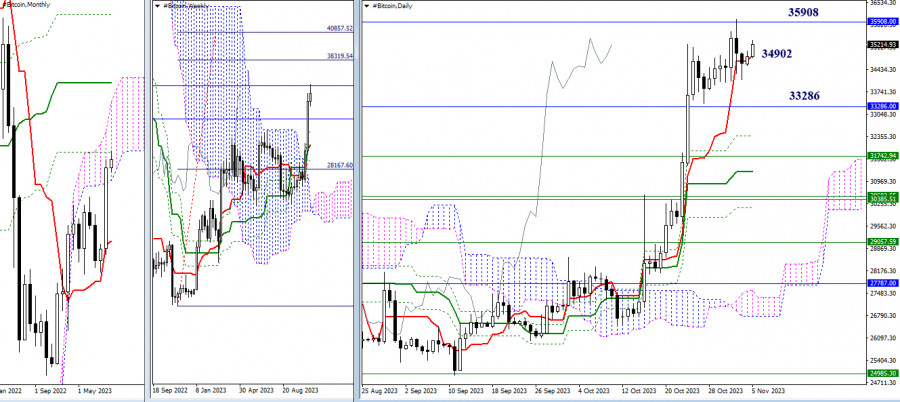
October provided bulls with moments of optimism, pushing the market away from the support of the monthly short-term trend towards the next resistance of the monthly death cross (35,908). Meanwhile, Bitcoin managed to close October within the monthly cloud (33,286), making the upper boundary of the Ichimoku cloud (40,490) the next upward target on this timeframe.

The result of October's activity was also the formation of an upward target for breaking the weekly cloud (38,320 - 40,858). These target levels (38,320 - 40,490 - 40,858) have been planned by the bullish players for November following the optimism and activity of October. This will only be possible if the bulls maintain and continue the October sentiment.

If priorities change and the bears return to the market. In that case, their focus will first be on exiting the monthly cloud (33,286) and then testing and liquidating the existing golden crosses of Ichimoku on the weekly and daily timeframes. The nearest supports from the golden crosses of Ichimoku at the moment can be noted at 32,380 - 31,743 - 31,261.

This image is no longer relevant

H4 - H1

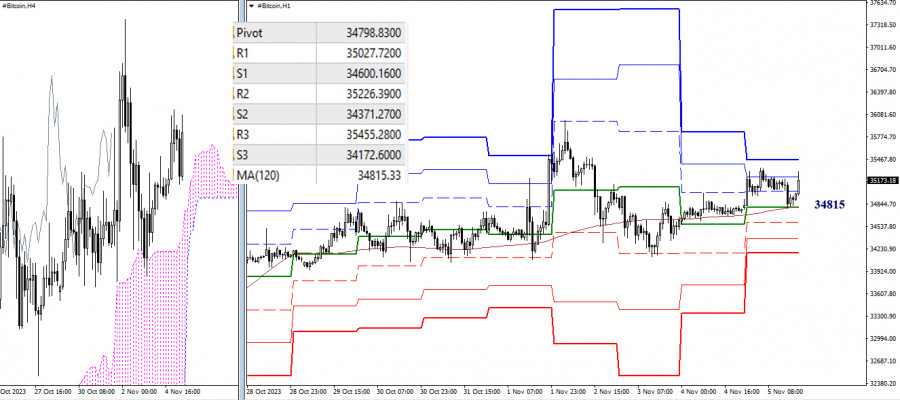
As of writing, the main advantage on the lower timeframes remains with the bullish players. However, the balance of power is very fragile because the weekly long-term trend (34,815) has been acting as support for a long time, responsible for the distribution and balance of power. Bitcoin can lose this support at any moment, after which the market's attention will shift within the day to the supports of the classic pivot points. The primary priority in this case will be the strengthening of bearish sentiments.

Note that the loss of the key level of the lower timeframes—34,815 (weekly long-term trend), is currently associated with losing the center of attraction of the daily timeframe—34,902 (short-term trend). A secure consolidation below 34,902 - 34,815 opens up new prospects for bears, both within the day and on the higher timeframes.

***

The technical analysis of the situation uses:

Higher timeframes - Ichimoku Kinko Hyo (9.26.52) + Fibo Kijun levels

H1 - Pivot Points (classic) + Moving Average 120 (weekly long-term trend)

Recommended Stories

Phân Tích Kỹ Thuật Tuần Từ Ngày 23–28 Tháng Sáu: Cặp Tiền Tệ GBP/USD

Tuần trước, cặp tiền này đã di chuyển xuống và kiểm tra mức hồi phục 14,6% tại 1,3392 (đường gạch đỏ), sau đó giá đã bật lên và đóng

Stefan Doll 11:38 2025-06-23 UTC+2

Phân tích kỹ thuật cho tuần từ ngày 23–28 tháng 6: Cặp tiền tệ EUR/USD

Tuần trước, cặp tiền đã di chuyển đi xuống và kiểm tra mức thoái lui 76,4% tại 1,1452 (đường gạch đỏ), sau đó giá đã hồi phục và đóng

Stefan Doll 11:31 2025-06-23 UTC+2

Dự báo cho EUR/USD vào ngày 23 tháng 6, 2025

Vào thứ Sáu, cặp EUR/USD tiếp tục tăng sau khi bật lên từ mức điều chỉnh 76,4% tại 1,1454. Tuy nhiên, vào đêm thứ Hai, cặp này đã quay

Samir Klishi 11:24 2025-06-23 UTC+2

Dự báo cho GBP/USD vào ngày 23 tháng 6 năm 2025

Trên biểu đồ giờ, cặp GBP/USD vào thứ Sáu đã cố định dưới vùng hỗ trợ 1.3425–1.3444, một lần nữa cho phép kỳ vọng sự giảm tiếp theo

Samir Klishi 11:19 2025-06-23 UTC+2

Phân tích kỹ thuật biến động giá hàng ngày của cặp tiền tệ ngoại lai USD/IDR, Thứ Hai ngày 23 tháng 6 năm 2025.

16473.27 Hiện tại trên biểu đồ hàng ngày, cặp tiền tệ lạ USD/IDR đang có mô hình Bullish 123 cho thấy USD/IDR đang mạnh lên, điều này cũng được

Arief Makmur 07:29 2025-06-23 UTC+2

Phân tích kỹ thuật biến động giá trong ngày của công cụ hàng hóa Dầu thô, Thứ Hai ngày 23 tháng 6, 2025.

Bên cạnh sự xuất hiện của sự Phân kỳ giữa sự di chuyển giá Dầu thô và chỉ báo Stochastic Oscillator trên biểu

Arief Makmur 07:29 2025-06-23 UTC+2

Dự báo EUR/USD cho ngày 23 tháng 6 năm 2025

Một phân kỳ giảm giá đã hình thành trên biểu đồ tuần đối với đồng euro. Chúng ta đang chuẩn bị cho sự đảo chiều sang xu hướng giảm

Laurie Bailey 05:00 2025-06-23 UTC+2

Dự báo GBP/USD cho ngày 23 tháng 6, 2025

Đồng bảng Anh khởi đầu tuần mới với một khoảng cách giảm giá, nhưng vẫn giữ được sự lạc quan của xu hướng tăng. Vẫn có khả năng

Laurie Bailey 04:56 2025-06-23 UTC+2

Dự Báo Dầu Cho Ngày 23 Tháng 6, 2025

Trên biểu đồ tuần, đường tín hiệu của bộ dao động Marlin đã bắt đầu đảo chiều từ mức 9,3600. Về lịch sử, mức này đã đánh

Laurie Bailey 04:56 2025-06-23 UTC+2

USD/JPY. Phân tích và Dự báo

Cặp tiền tệ này tiếp tục xu hướng giá di chuyển bên, giao dịch mà không có thay đổi đáng kể. Từ góc độ kỹ thuật, sức mạnh

Irina Yanina 20:41 2025-06-17 UTC+2
Không thể nói chuyện ngay bây giờ?
Đặt câu hỏi của bạn trong phần trò chuyện.
 

Dear visitor,

Your IP address shows that you are currently located in the USA. If you are a resident of the United States, you are prohibited from using the services of InstaFintech Group including online trading, online transfers, deposit/withdrawal of funds, etc.

If you think you are seeing this message by mistake and your location is not the US, kindly proceed to the website. Otherwise, you must leave the website in order to comply with government restrictions.

Why does your IP address show your location as the USA?

  • - you are using a VPN provided by a hosting company based in the United States;
  • - your IP does not have proper WHOIS records;
  • - an error occurred in the WHOIS geolocation database.

Please confirm whether you are a US resident or not by clicking the relevant button below. If you choose the wrong option, being a US resident, you will not be able to open an account with InstaTrade anyway.

We are sorry for any inconvenience caused by this message.