empty
28.03.2022 11:22 AM
EUR/USD, USD/JPY, GBP/JPY, GOLD simplified wave analysis and outlook for March 28

EUR/USD

Analysis:

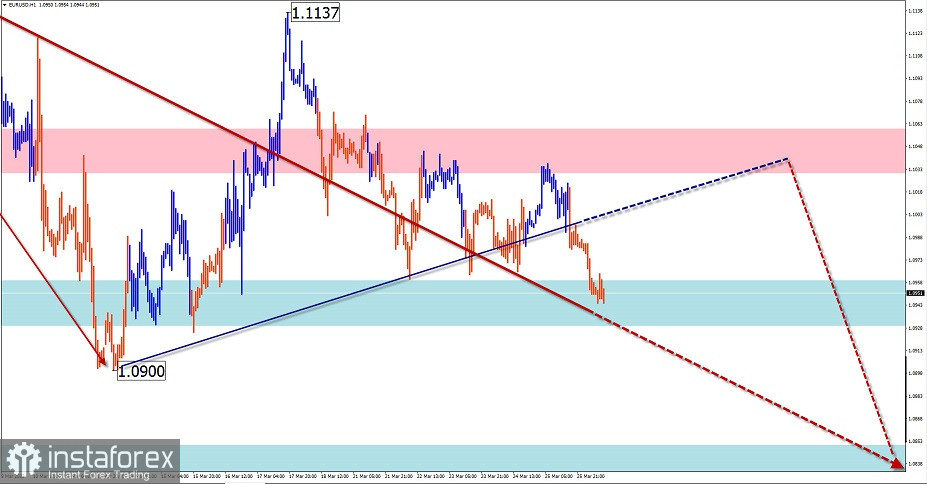
The daily chart shows the downtrend of the European currency major over the last year and a half. The incomplete section started on March 9 this year. Analysis of the structure of this wave shows the absence of the final part (C).

Forecast:

In the nearest trading sessions, we can expect a flat movement, mainly sideways. Short-term price growth is possible, not higher than the estimated resistance. At the end of the day, trading activity is likely to increase, with the resumption of the downward movement. In case the lower border of the nearest support is breached, the decline will continue to the next zone.

Potential reversal zones

Resistance:

- 1.1030/1.1060

Support:

- 1.0960/1.0930

- 1.0850/1.0820

Recommendations:

There are no buying conditions in the euro market today. It is recommended to refrain from trading the pair until there are confirmed sell signals.

This image is no longer relevant

USD/JPY

Analysis:

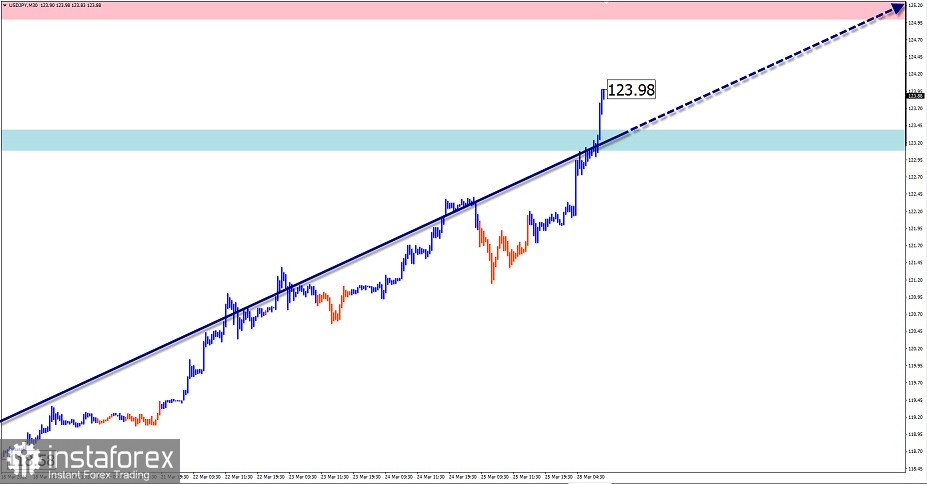
The Japanese yen has been weakening rapidly against the US dollar since the beginning of this year. The ascending impulse wave brings the price closer to the lower border of the preliminary target zone. The structure of the wave looks complete, but there are no signals of an imminent reversal.

Outlook:

A continuation of the general upward movement of the pair's exchange rate is expected today. Short-term stops in the form of sideways sections are possible during the day.

Potential reversal zones

Resistance:

- 125.00/125.30

Support:

- 123.40/123.10

Recommendations:

There are no conditions to open short positions in the yen today. It is recommended to watch for buying signals at the end of all counter-movements.

This image is no longer relevant

GBP/JPY

Analysis:

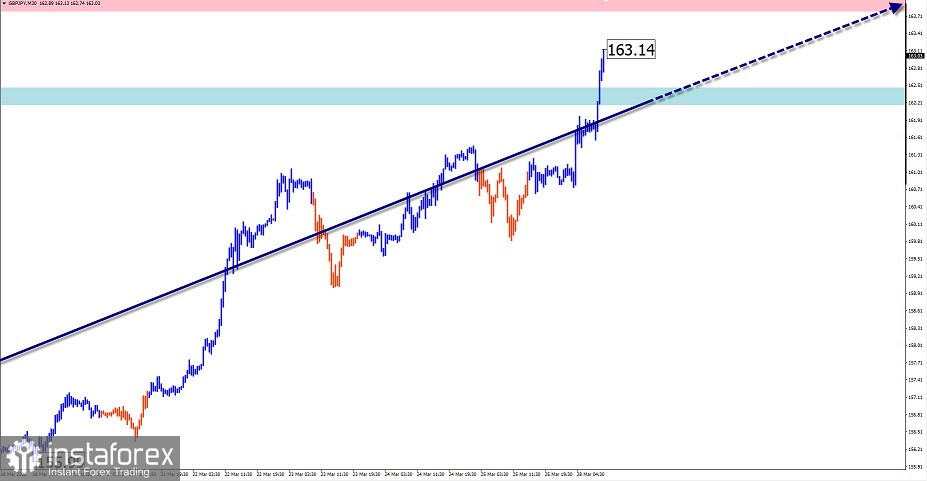
The trend direction of the English Pound/Japanese Yen cross over the last two years is set by an ascending wave algorithm. The incomplete section traces back to March 8. The price movement has a clear impulsive nature. By now the price has sold the level of the intermediate resistance zone.

Outlook:

In the near future, the general upward movement vector is expected to continue. On the forthcoming session short-term flat is possible along the support zone. The highest activity is likely at the end of the day, or tomorrow.

Potential reversal zones

Resistance:

- 163.80/164.10

Support:

- 162.50/162.20

Recommendations:

In the cross market today, we recommend to look for signals at the end of all counter-movements to buy the instrument.

This image is no longer relevant

GOLD

Analysis:

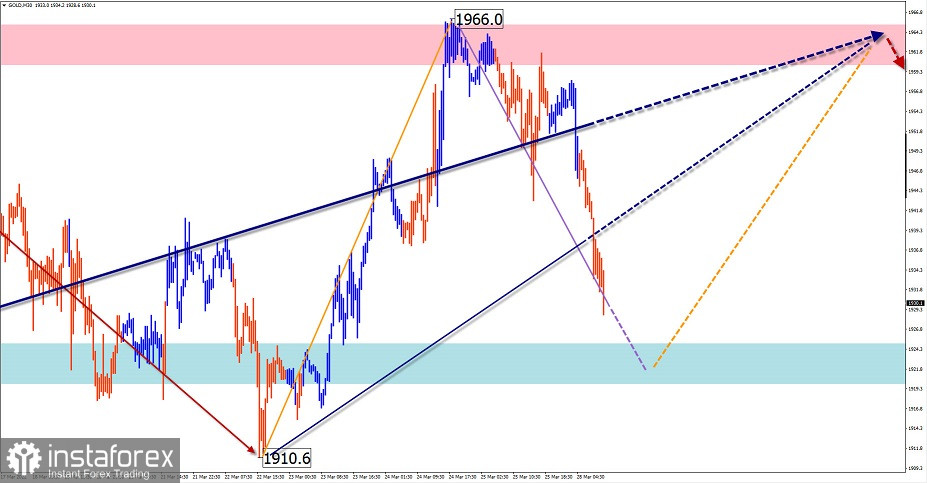
The downward wave from March 8 is setting the main direction for gold's price swings. An intermediate correction has been forming in the last 2 weeks. The structure of this move is not complete.

Outlook:

In the current day, the end of the downward movement, the formation near the support zone of the reversal and the resumption of price growth can be expected. A breakout beyond the boundaries of estimated resistance is unlikely.

Potential reversal zones

Resistance:

- 1960.0/1965.0

Support:

- 1925.0/1920.0

Recommendations:

Trading in the gold market today is risky and could lead to losses. Short-term buying with fractional lots will be possible after reversal signals appear in the support area.

This image is no longer relevant

Explanation: In simplified wave analysis (SVA), waves consist of 3 parts (A-B-C). The last unfinished wave is analysed. The solid arrow background shows the structure formed. The dotted arrow shows the expected movements.

Attention: The wave algorithm does not take into account the duration of the instrument movements over time!

Recommended Stories

Phân tích EUR/USD ngày 27 tháng 8, 2025

Mô hình sóng trên biểu đồ 4 giờ cho EUR/USD đã không thay đổi qua nhiều tháng nay, điều này rất đáng khích lệ. Ngay cả khi các sóng hiệu

Chin Zhao 19:04 2025-08-27 UTC+2

Phân tích GBP/USD ngày 27 tháng 8 năm 2025

Đối với cặp GBP/USD, cấu trúc sóng tiếp tục chỉ ra sự hình thành của một chuỗi sóng đi lên mạnh mẽ. Mẫu sóng gần như giống hệt với EUR/USD

Chin Zhao 18:51 2025-08-27 UTC+2

Phân tích EUR/USD ngày 26 tháng 8, 2025

Mô hình sóng trên biểu đồ 4 giờ của EUR/USD không có nhiều thay đổi trong vài tháng qua, điều này là một tín hiệu lạc quan. Ngay

Chin Zhao 19:32 2025-08-26 UTC+2

Phân tích GBP/USD ngày 26 tháng 8, 2025

Đối với GBP/USD, cấu trúc sóng tiếp tục chỉ ra sự hình thành của một chuỗi sóng tăng. Mô hình sóng gần như trùng hợp với EUR/USD, vì "thủ phạm"

Chin Zhao 19:30 2025-08-26 UTC+2

Phân tích EUR/USD ngày 25 tháng 8, 2025

Mô hình sóng trên biểu đồ 4 giờ của cặp EUR/USD không thay đổi trong vài tháng, điều này là một dấu hiệu đáng khích lệ. Ngay cả trong

Chin Zhao 19:10 2025-08-25 UTC+2

Phân tích GBP/USD vào ngày 25 tháng 8, 2025

Đối với cặp GBP/USD, mô hình sóng tiếp tục cho thấy sự phát triển của cấu trúc sóng tăng. Hình ảnh sóng gần như đồng nhất với EUR/USD vì "lực

Chin Zhao 19:08 2025-08-25 UTC+2

Dự báo hàng tuần dựa trên Phân tích Sóng Đơn giản hóa cho GBP/USD, AUD/USD, USD/CHF, EUR/JPY, AUD/JPY, #Ethereum và Chỉ số Đô la Mỹ vào ngày 25 tháng 8

Vào đầu tuần tới, đồng bảng Anh có thể cho thấy một xu hướng di chuyển ngang ngắn hạn với xu hướng đi xuống. Áp lực lên vùng

Isabel Clark 12:16 2025-08-25 UTC+2

Dự báo hàng tuần dựa trên Phân tích Sóng Đơn giản cho EUR/USD, USD/JPY, GBP/JPY, USD/CAD, NZD/USD, Vàng, và Bitcoin tính đến ngày 25 tháng 8

Trong tuần tới, dự kiến đồng euro sẽ di chuyển trong hành lang giữa các vùng đối lập gần nhất. Trong những ngày đầu, có thể dự đoán sự tăng

Isabel Clark 12:10 2025-08-25 UTC+2

Phân tích EUR/USD vào ngày 22 tháng 8 năm 2025

Mô hình sóng trên biểu đồ 4 giờ cho EUR/USD đã không thay đổi trong vài tháng, điều này rất đáng khích lệ. Ngay cả khi các sóng điều chỉnh

Chin Zhao 22:02 2025-08-22 UTC+2

Phân tích GBP/USD ngày 22 tháng 8, 2025

Đối với cặp tiền GBP/USD, mô hình sóng tiếp tục chỉ ra sự phát triển của một cấu trúc sóng tăng mạnh. Cấu hình sóng gần như giống với EUR/USD

Chin Zhao 16:04 2025-08-22 UTC+2
Không thể nói chuyện ngay bây giờ?
Đặt câu hỏi của bạn trong phần trò chuyện.
 

Dear visitor,

Your IP address shows that you are currently located in the USA. If you are a resident of the United States, you are prohibited from using the services of InstaFintech Group including online trading, online transfers, deposit/withdrawal of funds, etc.

If you think you are seeing this message by mistake and your location is not the US, kindly proceed to the website. Otherwise, you must leave the website in order to comply with government restrictions.

Why does your IP address show your location as the USA?

  • - you are using a VPN provided by a hosting company based in the United States;
  • - your IP does not have proper WHOIS records;
  • - an error occurred in the WHOIS geolocation database.

Please confirm whether you are a US resident or not by clicking the relevant button below. If you choose the wrong option, being a US resident, you will not be able to open an account with InstaTrade anyway.

We are sorry for any inconvenience caused by this message.