


Los patrones son modelos gráficos que se forman en el gráfico mediante el precio. Según uno de los postulados del análisis técnico, la historia (movimiento del precio) se repite. Esto quiere decir que los movimientos del precio a menudo son similares en las mismas situaciones que hacen posible pronosticar el futuro desarrollo de la situación con una alta probabilidad.
Los patrones relevantes de InstaTrade son un servicio fácil de utilizar que permiten que conozca los últimos cambios en el mercado y reaccione a las pistas del mercado a tiempo. En nuestro servicio, siempre encontrará los últimos y más importantes patrones en cualquier par y en cualquier marco de tiempo.
Bearish Flag
was formed on 19.06 at 09:57:29 (UTC+0)
signal strength 3 of 5
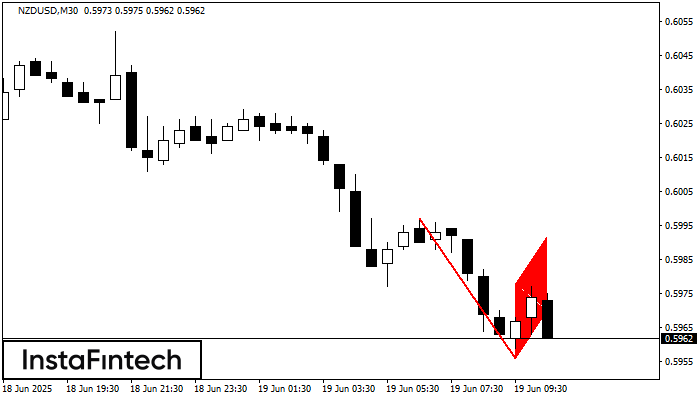
The Bearish Flag pattern has been formed on NZDUSD at M30. The lower boundary of the pattern is located at 0.5956/0.5970 while the upper boundary lies at 0.5978/0.5992. The projection of the flagpole is 41 points. This formation signals that the downward trend is most likely to continue. Therefore, if the level of 0.5956 is broken, the price will move further downwards.


