Double Top
was formed on 05.06 at 16:30:13 (UTC+0)
signal strength 4 of 5
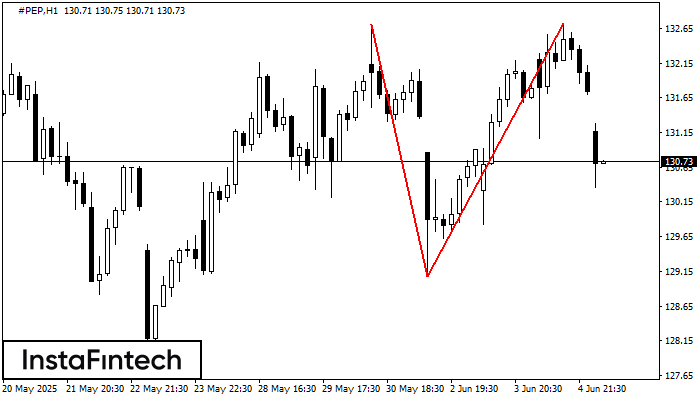
On the chart of #PEP H1 the Double Top reversal pattern has been formed. Characteristics: the upper boundary 132.72; the lower boundary 129.07; the width of the pattern 365 points. The signal: a break of the lower boundary will cause continuation of the downward trend targeting the 128.67 level.
Vea asimismo
- All
- All
- Bearish Rectangle
- Bearish Symmetrical Triangle
- Bullish Rectangle
- Double Top
- Double Top
- Triple Bottom
- Triple Bottom
- Triple Top
- Triple Top
- All
- All
- Buy
- Sale
- All
- 1
- 2
- 3
- 4
- 5
Cabeza y Hombros
was formed on 23.07 at 21:36:38 (UTC+0)
signal strength 1 of 5
El patrón técnico llamado Cabeza y Hombros ha aparecido en el gráfico de #NTDOY M5. Existen razones poderosas para sugerir que el precio superará la línea de cuello 22.12/22.12 después
Los marcos de tiempo M5 y M15 pueden tener más puntos de entrada falsos.
Open chart in a new window
Cabeza y Hombros
was formed on 23.07 at 21:36:33 (UTC+0)
signal strength 1 of 5
El #NTDOY M5 formó el patrón Cabeza y Hombros con las siguientes características: El techo de la Cabeza se encuentra en 22.21, la línea de cuello y el ángulo alcista
Los marcos de tiempo M5 y M15 pueden tener más puntos de entrada falsos.
Open chart in a new window
Rectángulo Alcista
was formed on 23.07 at 20:33:19 (UTC+0)
signal strength 3 of 5
Según el gráfico de M30, #TSLA formó el Rectángulo Alcista que es un patrón de la continuación de una tendencia. El patrón está contenido dentro de los siguientes límites
Open chart in a new window