empty
05.06.2025 11:22 AM
Forecast for EUR/USD on June 5, 2025
On Wednesday, the EUR/USD pair rebounded from the support zone of 1.1374–1.1380 and reversed in favor of the euro. A new upward move toward the 76.4% retracement level at 1.1454 began. A rebound from this level would favor the U.S. dollar and a slight decline back toward the 1.1374–1.1380 support zone. A consolidation above 1.1454 will increase the likelihood of continued growth toward the next Fibonacci level of 100.0% at 1.1574.

This image is no longer relevant

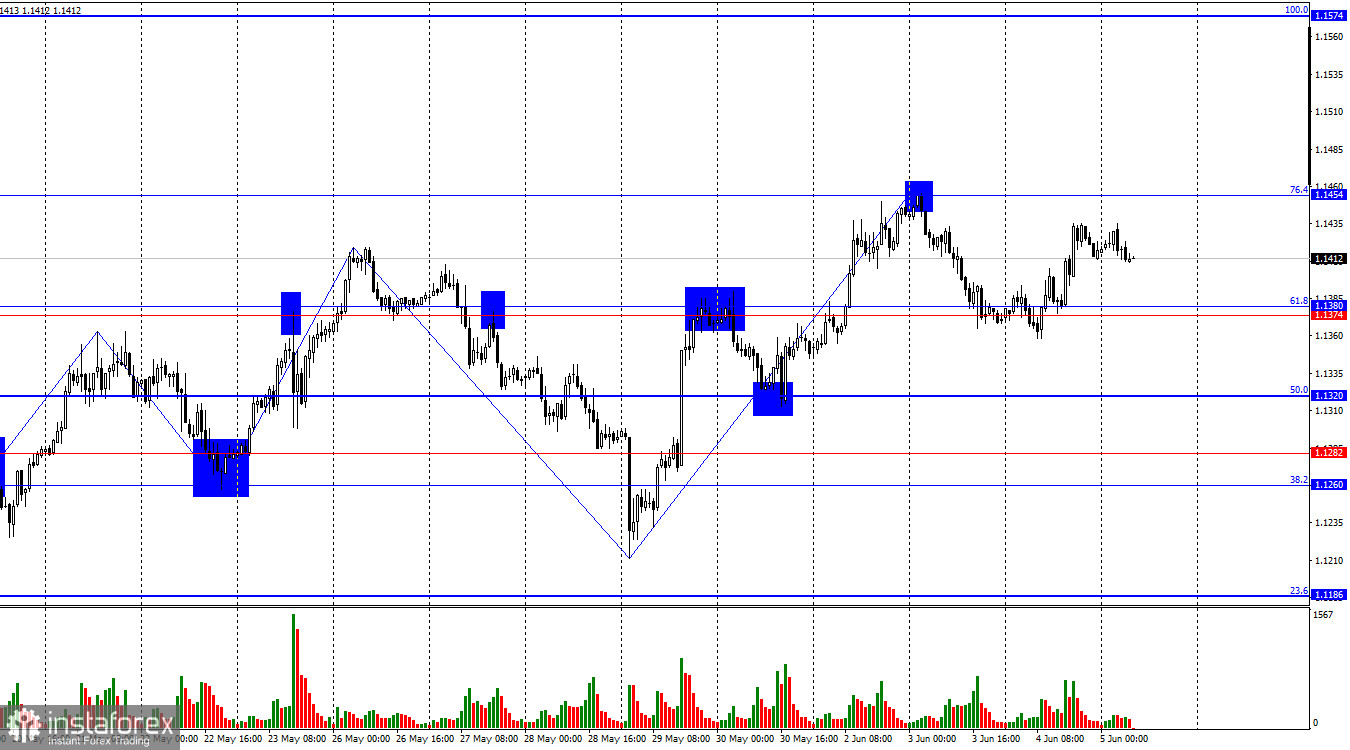
The wave structure on the hourly chart has changed. The last completed downward wave broke the previous low, but the last completed upward wave broke the previous peak. Thus, the trend remains "bullish" despite some signs of a reversal. The latest news about potential tariff increases on steel and aluminum caused the bears to retreat once again.

The news background on Wednesday was disastrous for the bears. Recall that over the past few weeks, bears have made several attempts to reverse the trend, but every time, the news background prevented it. As soon as the market began hoping for de-escalation in the trade war, Trump immediately raised tariffs. Just as China and the U.S. agreed to lower tariffs for 90 days for negotiations, Trump lashed out at Beijing again. Just as traders began to count on overturning Trump's tariffs in court, another court overturned the decision of the first. And yesterday, the economic backdrop consisted of three reports, each supporting the bulls. Today, the ECB meeting will take place, and traders are certain that monetary policy will be eased again. However, this factor currently plays no significant role for traders. The rate cut has been anticipated since last week, and the bears have failed to take advantage of it. Today, the bulls may retreat slightly, but I do not expect a close below the 1.1374–1.1380 zone.

This image is no longer relevant

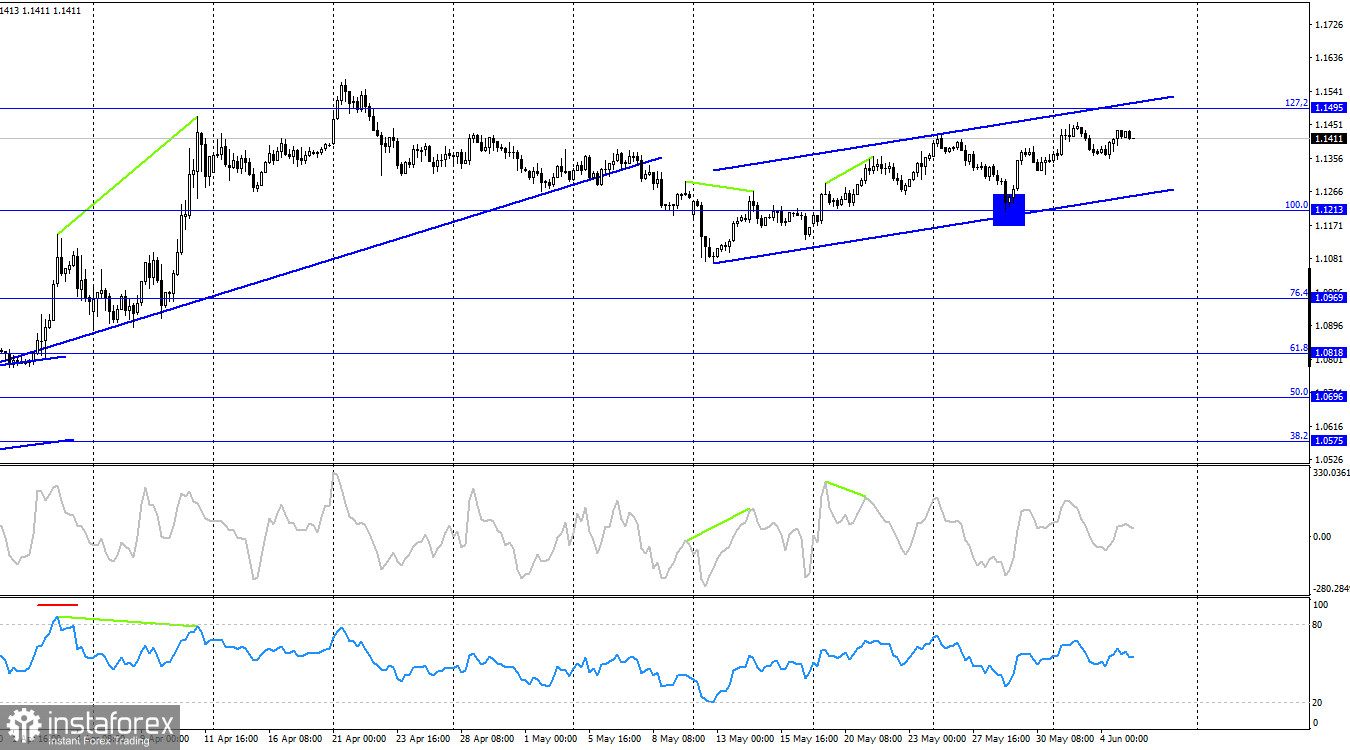
On the 4-hour chart, the pair rebounded from the 100.0% Fibonacci retracement level at 1.1213 and continued its upward move toward the 127.2% retracement level at 1.1495. A rebound from the 1.1495 level would favor the U.S. dollar and trigger a slight decline, while a consolidation above this level would increase the chances of continued growth toward the 161.8% retracement level at 1.1851. No emerging divergences are observed on any indicator. The trend channel again signals that the "bullish" trend remains intact.

Commitments of Traders (COT) Report:

This image is no longer relevant

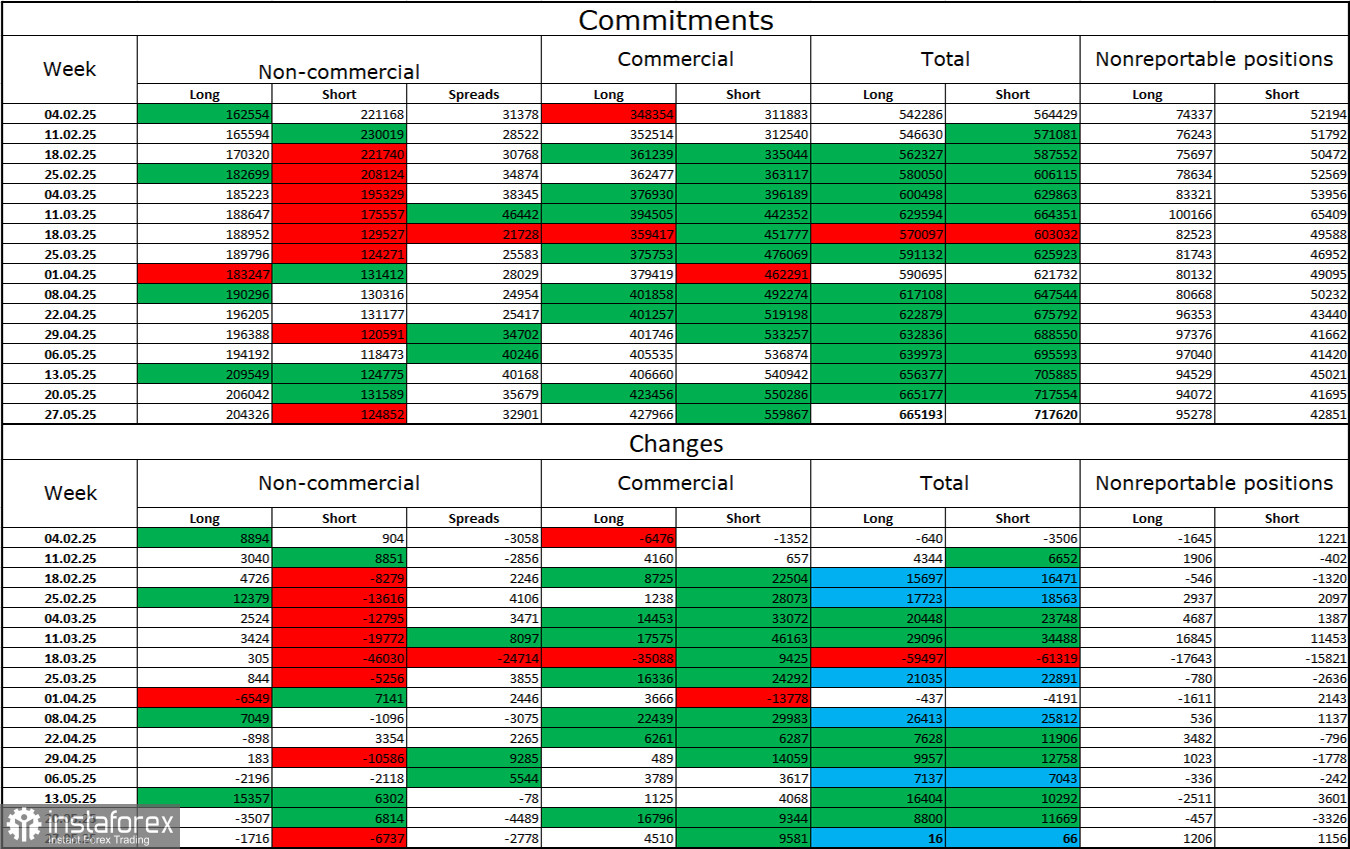
Over the last reporting week, professional players closed 1,716 long positions and 6,737 short positions. Sentiment among the "Non-commercial" group remains "bullish" thanks to Donald Trump. The total number of long positions held by speculators is now 204,000, while short positions total 124,000, with the gap (with rare exceptions) constantly widening. Thus, the euro remains in demand, while the dollar does not. The situation remains unchanged.

For seventeen consecutive weeks, major players have been reducing short positions and increasing long ones. The divergence in monetary policy approaches between the ECB and the Fed continues to favor the U.S. dollar due to the widening interest rate differential. However, Donald Trump's policies remain a more significant factor for traders, as they could trigger a recession in the U.S. economy and numerous long-term structural issues.

News Calendar for the U.S. and Eurozone:

  • Eurozone – ECB Interest Rate Decision (12:15 UTC)
  • Eurozone – ECB Press Conference (12:45 UTC)
  • U.S. – Initial Jobless Claims (12:30 UTC)

The economic calendar for June 5 includes three entries, two of which can be considered important. The influence of the news background on market sentiment on Thursday could be moderate, as ECB meetings do not happen every day.

EUR/USD Forecast and Trader Tips:

Selling the pair was possible on a rebound from the 1.1454 level with targets at 1.1374–1.1380 and 1.1320. The first target was reached, but the second was not. Buying was recommended on a rebound from the 1.1320 level on the hourly chart with a target of 1.1374–1.1380. If the price closes above the 1.1374–1.1380 zone, positions can be held with a target of 1.1454.

Fibonacci grids are drawn from 1.1574–1.1066 on the hourly chart and from 1.1214–1.0179 on the 4-hour chart.

Recommended Stories

Bitcoin. El fortalecimiento del dólar podría dar un giro bajista al mercado de criptomonedas

Hoy, el mercado se centrará en la publicación del informe sobre la inflación en Estados Unidos, que se espera que muestre no solo que ha dejado de bajar, sino

Pati Gani 13:12 2025-06-11 UTC+2

Bitcoin. El logro de nuevos máximos puede detenerse

El precio del Bitcoin superó momentáneamente el nuevo nivel histórico de 111 000, pero no logró consolidarse por encima de él. El apoyo proviene, tanto para él como para

Pati Gani 10:53 2025-05-22 UTC+2

EUR/USD. El 12 de mayo. El conflicto en Ucrania podría llegar a su fin.

Buenos días, estimados traders. El par EUR/USD el viernes subió hacia la zona de resistencia 1,1265 – 1,1282, rebotó desde allí y giró a favor del dólar estadounidense. El proceso

Samir Klishi 10:27 2025-05-12 UTC+2

Pronóstico para el gas al 8 de abril de 2025

Gas natural (NG) Ni al final de la semana pasada, ni mucho menos al comienzo de la actual, la cotización del gas natural logró superar la resistencia de 4.200, reforzada

Laurie Bailey 08:11 2025-04-08 UTC+2

Pronóstico del gas para el 17 de marzo de 2025

Gas natural (NG) La jornada de hoy se abrió por encima de la línea indicadora Kruzenshtern en el marco diario. Al mismo tiempo, el oscilador Marlin cambió de dirección hacia

Laurie Bailey 07:02 2025-03-17 UTC+2

Pronóstico para el Bitcoin el 21 de febrero de 2025

Bitcoin El Bitcoin ha cambiado de opinión sobre el desarrollo de una caída hacia soportes objetivos cómodos, y en su lugar, siguiendo el sentimiento de riesgo general, ha revertido desde

Laurie Bailey 07:23 2025-02-21 UTC+2

Bitcoin - análisis técnico de la situación

Viernes, y el Bitcoin sigue esperando. Ninguna de las partes enfrentadas tiene prisa por presentarse y ser activa. En la incertidumbre actual, el posicionamiento de los principales índices de referencia

Evangelos Poulakis 07:45 2025-02-14 UTC+2

Previsión para el gas natural (GN) del 5 de febrero de 2025

En el gráfico semanal la semana pasada el precio se revirtió desde el nivel de soporte 3.017 - desde los máximos de septiembre 2024, agosto 2023, febrero 2023 y también

Laurie Bailey 07:51 2025-02-05 UTC+2

#NDX - análisis técnico de la situación

A finales del año pasado, el índice marcó un nuevo máximo histórico (22141), tras lo cual se detuvo la subida, comenzó la formación de la corrección y la consolidación. Ahora

Evangelos Poulakis 07:24 2025-02-04 UTC+2

Bitcoin 30 Enero - análisis técnico de la situación

A pesar de marcar un nuevo máximo la semana pasada (109986), el Bitcoin detuvo su tendencia alcista y comenzó a formar incertidumbre. Hasta ahora, el formato semanal ha proyectado

Evangelos Poulakis 07:24 2025-01-30 UTC+2
¿No puede hablar ahora mismo?
Ingrese su pregunta en el chat.
 

Dear visitor,

Your IP address shows that you are currently located in the USA. If you are a resident of the United States, you are prohibited from using the services of InstaFintech Group including online trading, online transfers, deposit/withdrawal of funds, etc.

If you think you are seeing this message by mistake and your location is not the US, kindly proceed to the website. Otherwise, you must leave the website in order to comply with government restrictions.

Why does your IP address show your location as the USA?

  • - you are using a VPN provided by a hosting company based in the United States;
  • - your IP does not have proper WHOIS records;
  • - an error occurred in the WHOIS geolocation database.

Please confirm whether you are a US resident or not by clicking the relevant button below. If you choose the wrong option, being a US resident, you will not be able to open an account with InstaTrade anyway.

We are sorry for any inconvenience caused by this message.