empty
02.06.2025 07:07 PM
EUR/USD Analysis on June 2, 2025

This image is no longer relevant

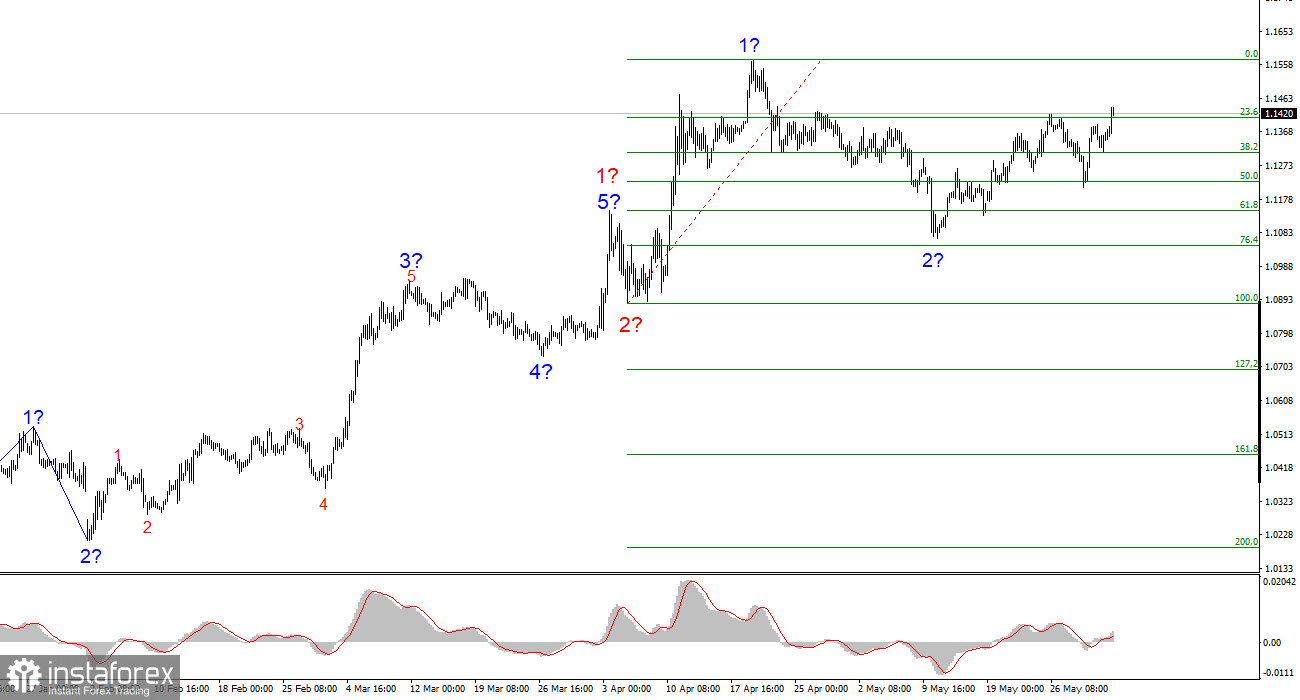
The wave structure on the 4-hour chart for EUR/USD has transformed into a bullish formation and continues to hold that shape. I believe there is no doubt that this transformation occurred solely due to the new U.S. trade policy. Before February 28, when the sharp decline of the U.S. dollar began, the wave structure appeared as a convincing downward trend segment. A corrective wave 2 was forming. However, Trump's weekly announcements about various tariffs did their job. Demand for the U.S. dollar began to plummet, and the entire trend segment that began on January 13 has now taken on an impulsive bullish form.

Currently, wave 2 within wave 3 is presumably complete. If this assumption is correct, price growth should continue over the coming weeks and months. However, the U.S. dollar will likely remain under pressure unless Donald Trump completely reverses his trade policy — a scenario that seems highly unlikely given recent events. At the moment, there are no reasons to expect strong growth for the U.S. currency.

The EUR/USD exchange rate rose by 70 basis points on Monday even before the U.S. session started. There was plenty of news encouraging new dollar sell-offs. This "new saga" began last Thursday when the Federal Appeals Court overturned the decision of the International Trade Court that had annulled almost all tariffs imposed by Donald Trump. Thus, hopes for a sharp de-escalation of the trade conflict lasted no more than one day. Thursday clearly demonstrated that even explicit laws outlining presidential powers are not being enforced consistently. Interestingly, the Appeals Court has yet to explain its rationale. On what basis did it overturn the Trade Court's decision, which was based solely on current legislation? How can two different courts interpret the same law differently? Trump's team didn't even have time to reframe its position or present new evidence and arguments. One court canceled the tariffs, and the second one canceled the cancellation.

Therefore, it's no surprise that demand for the U.S. dollar is falling again. This morning, Germany and the Eurozone also released manufacturing PMI reports, none of which impressed. Germany's index fell from 48.4 to 48.3 points, and although the Eurozone's index rose slightly, the market had been expecting a rise anyway.

This image is no longer relevant

General Conclusions

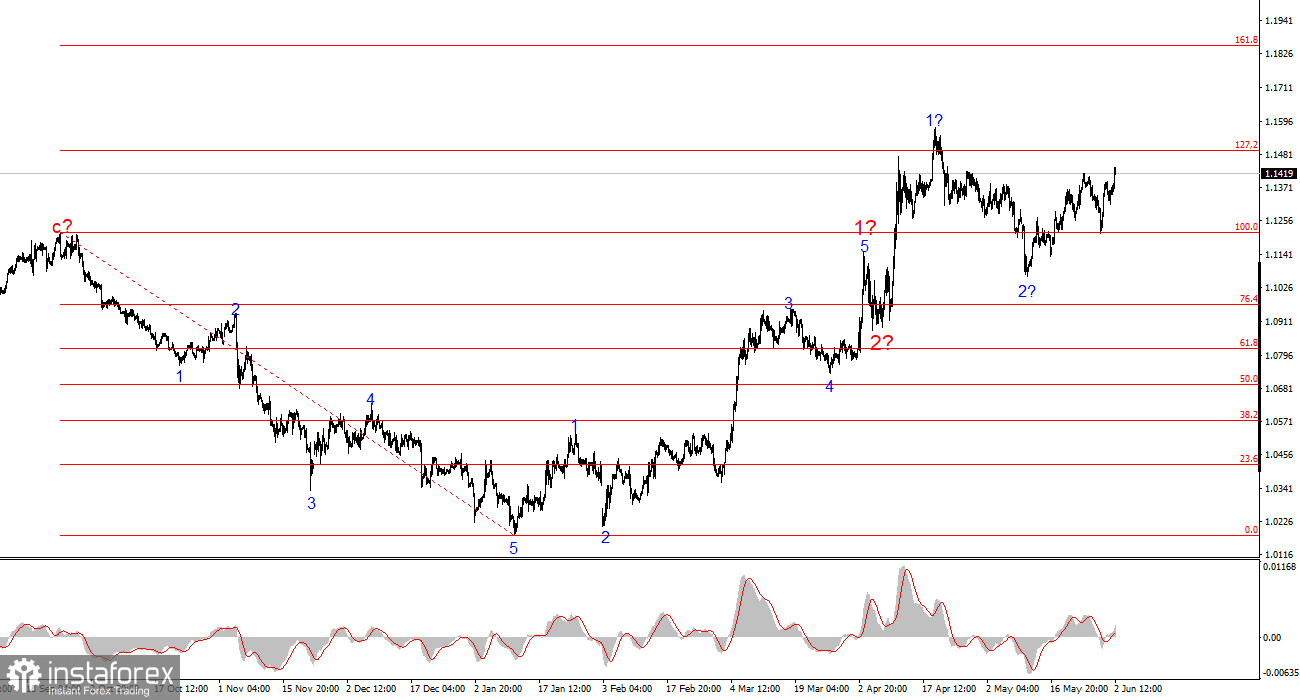
Based on the conducted analysis of EUR/USD, I conclude that the pair continues constructing an upward trend segment. In the near future, the wave pattern will entirely depend on the news background, particularly related to Trump's decisions and U.S. foreign policy. The construction of wave 3 of the upward trend segment has begun, and its targets could extend to the 1.2500 area. Therefore, I am considering buying with targets above 1.1572, corresponding to 423.6% Fibonacci levels. It's important to remember that a de-escalation of the trade war could reverse the uptrend, but at the moment, there are no signs of reversal or de-escalation.

On the higher wave scale, the wave pattern has shifted to a bullish outlook. We are likely facing a long-term series of rising waves, though news from Donald Trump could once again turn everything upside down.

Key Principles of My Analysis:

  1. Wave structures should be simple and clear. Complex structures are difficult to trade and often subject to frequent changes.
  2. If there is uncertainty about the market situation, it is better to stay out.
  3. Absolute certainty about the direction of movement never exists. Always use protective Stop Loss orders.
  4. Wave analysis can be combined with other types of analysis and trading strategies.

Recommended Stories

SP500 25 de abril. ¡Subimos siguiendo a Bitcoin!

Desde el punto de vista de las ondas de Elliott, en el índice se está formando una gran tendencia impulsiva en una perspectiva global. No hace mucho se completó

Roman Onegin 10:06 2025-04-25 UTC+2

NG 12 Feb. ¡Los toros mantienen el rumbo hacia un máximo de 4,31!

El marco temporal de cuatro horas muestra el trazado de una onda activa principal (Y), que tiene una forma interna compleja y es un doble zigzag de un nivel

Roman Onegin 07:26 2025-02-12 UTC+2

SP500 12 de febrero. ¡Después de la finalización de la segunda parte del impulso, el precio puede subir más activamente!

Lo más probable es que se esté formando una tendencia alcista mayor en el panorama global del SP500, cuya estructura es similar a la del impulso. Si nos fijamos

Roman Onegin 07:26 2025-02-12 UTC+2

Análisis del par EUR/USD. El 7 de julio. ¿Dónde se encuentra la raíz de todos los problemas del dólar?

El conteo de ondas en el gráfico de 4 horas para el instrumento EUR/USD permanece sin cambios. Actualmente estamos observando la formación de la supuesta onda

Chin Zhao 15:58 2024-07-07 UTC+2

Análisis del par EUR/USD. El 6 de julio. El destino complicado del dólar.

El conteo de ondas en el gráfico de 4 horas para el instrumento EUR/USD permanece sin cambios. Actualmente estamos observando la formación de la supuesta onda

Chin Zhao 15:57 2024-07-07 UTC+2

Análisis del par GBP/USD. El 6 de julio. La libra quiere caer, pero no puede.

La estructura de ondas del instrumento GBP/USD sigue siendo bastante complicada y muy confusa. Alrededor del nivel de 1.2822, que corresponde al 23.6% de Fibonacci y está cerca del pico

Chin Zhao 15:57 2024-07-07 UTC+2

Análisis del par GBP/USD. El 22 de junio. El mercado espera la primera bajada de los tipos de interés en agosto.

El patrón de onda para el instrumento GBP/USD sigue siendo bastante complicado y confuso. Un intento exitoso de romper el nivel de Fibonacci del 50,0% en abril indicó

Chin Zhao 13:12 2024-06-22 UTC+2

Análisis del par EUR/USD. El 22 de junio. La Fed: No está lista para el aterrizaje.

En el gráfico de 4 horas, no hay cambios en la marca de la onda para el instrumento EUR/USD. En este momento, observamos la construcción de la esperada onda

Chin Zhao 10:51 2024-06-22 UTC+2

Análisis del par GBP/USD. El 8 de junio. Los británicos retrocedieron, pero no se rindieron.

El patrón de onda para el instrumento GBP/USD sigue siendo bastante complicado. El intento exitoso de romper el nivel de Fibonacci del 50,0% en abril indicó que el mercado está

Chin Zhao 08:27 2024-06-09 UTC+2

Análisis del par EUR/USD. El 8 de junio. El BCE confía en una mayor desaceleración de la inflación.

El patrón de onda del gráfico de 4 horas para el instrumento EUR/USD se mantiene sin cambios. En este momento, estamos observando la construcción de la onda esperada

Chin Zhao 08:26 2024-06-09 UTC+2
¿No puede hablar ahora mismo?
Ingrese su pregunta en el chat.
 

Dear visitor,

Your IP address shows that you are currently located in the USA. If you are a resident of the United States, you are prohibited from using the services of InstaFintech Group including online trading, online transfers, deposit/withdrawal of funds, etc.

If you think you are seeing this message by mistake and your location is not the US, kindly proceed to the website. Otherwise, you must leave the website in order to comply with government restrictions.

Why does your IP address show your location as the USA?

  • - you are using a VPN provided by a hosting company based in the United States;
  • - your IP does not have proper WHOIS records;
  • - an error occurred in the WHOIS geolocation database.

Please confirm whether you are a US resident or not by clicking the relevant button below. If you choose the wrong option, being a US resident, you will not be able to open an account with InstaTrade anyway.

We are sorry for any inconvenience caused by this message.