Vea también

 18.07.2024 09:50 AM
The UK inflation data was published on Wednesday, with the rate flatline at 2%, the lowest level since 2021. However, economists had mostly expected a drop to 1.9%.
The euro area inflation data was also published on the same day. The final figures matched the preliminary estimate, so the market did not react to this report.
During the US trading session, industrial production data was released, which showed that the growth rate in the United States accelerated from 0.3% to 1.6%, against an expectation of a rise to 0.4%.
The EUR/USD pair, whose long positions have strengthened and has settled above the 1.0900 level, has moved towards the main psychological level of 1.1000.
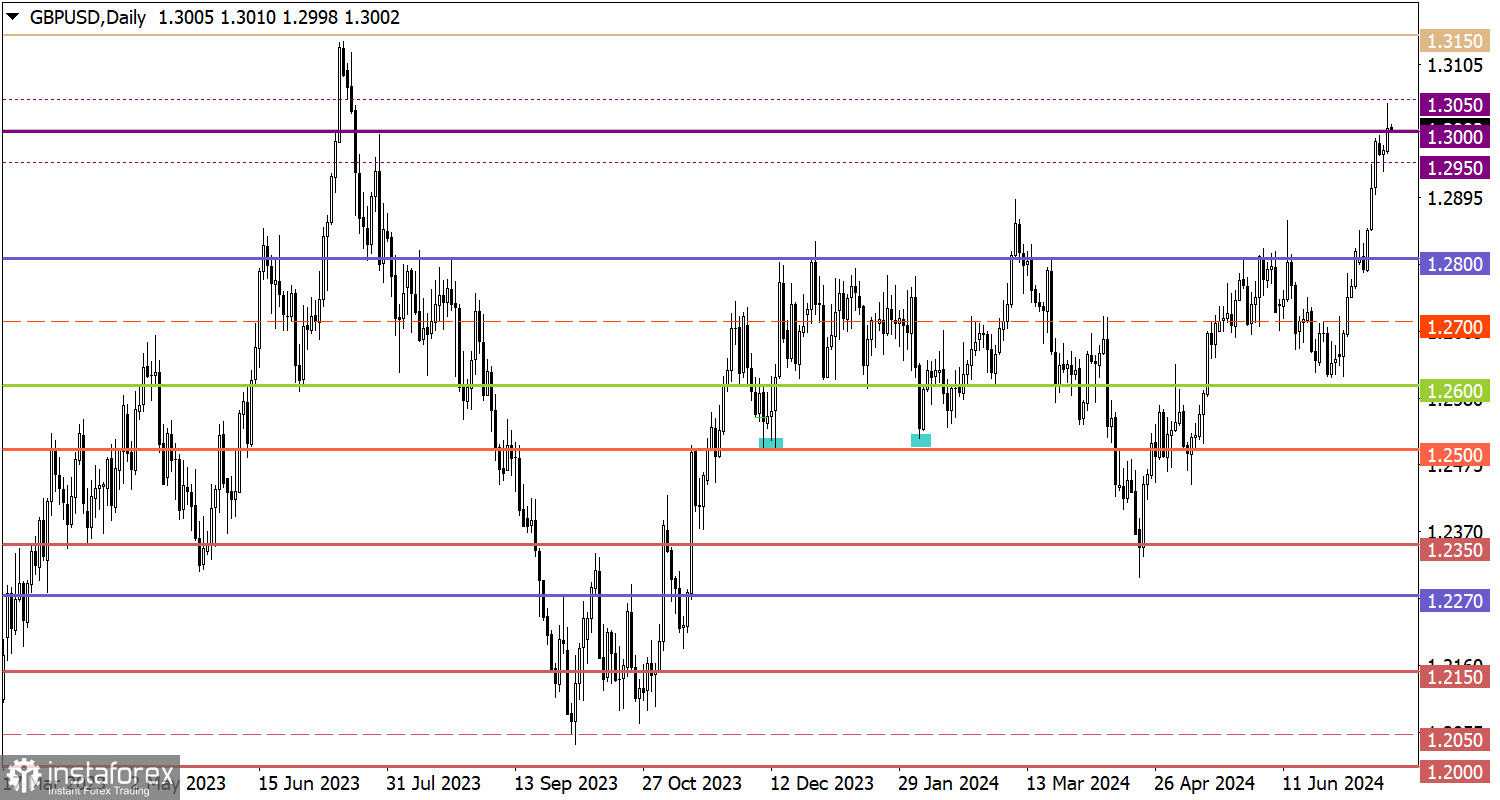
The GBP/USD pair is also showing a bullish trend, confirmed by the impulsive move above the 1.3000 level.
Today, market participants will focus on the European Central Bank's policy meeting. Interest rates are expected to remain unchanged. Given the inflation dynamics and extremely weak macroeconomic data, ECB President Christine Lagarde may hint at a more active easing of monetary policy. This could indicate a further increase in the interest rate disparity between the dollar and the euro in favor of the dollar, and as a result, the US currency may pull back to the levels seen at the start of yesterday's trading.
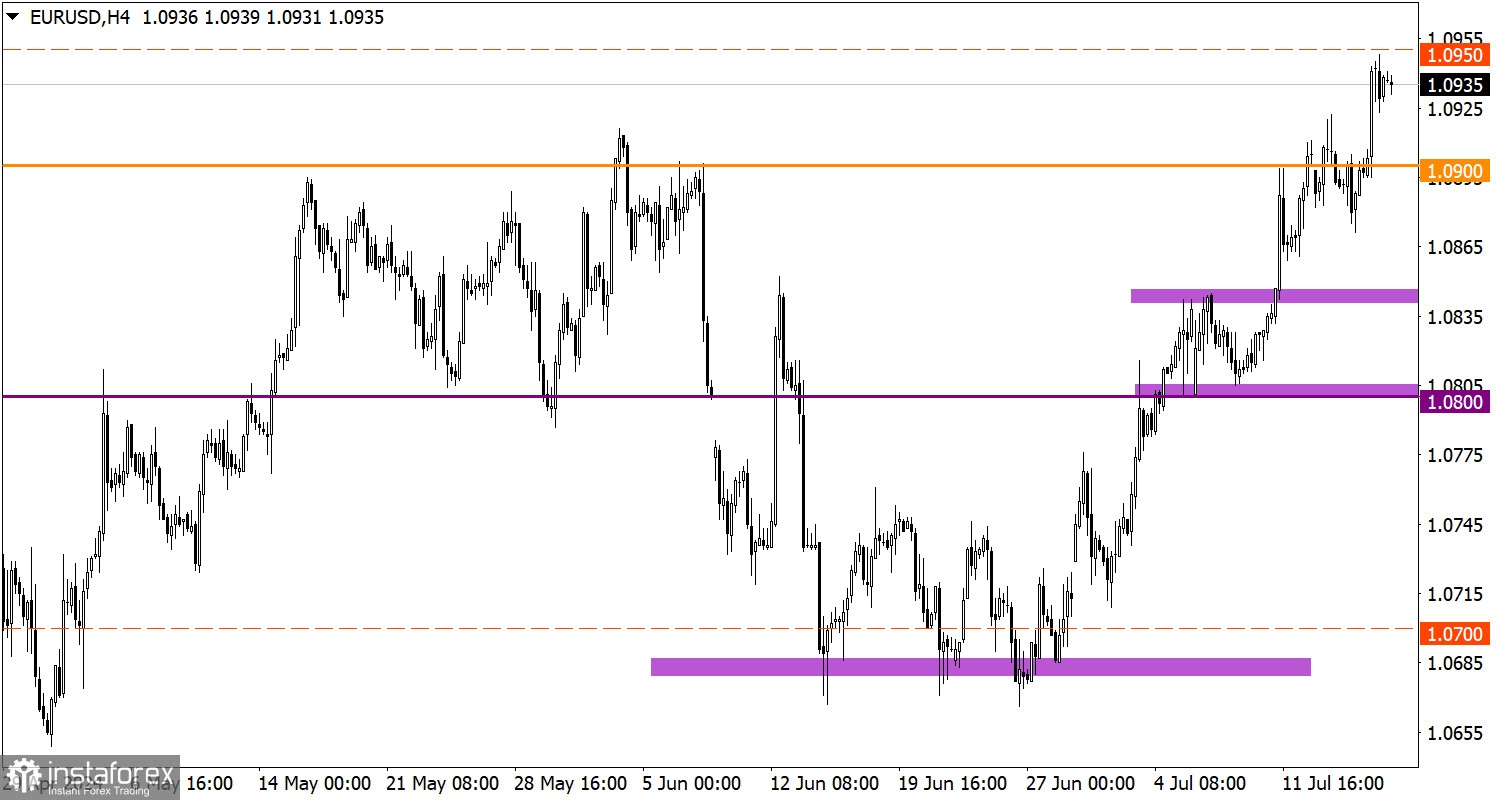
In case the pair rises further, the quote may reach the psychological level of 1.1000. However, it is important to consider the euro's overbought status, which does not rule out the possibility of a pullback or stagnation within this level, especially given today's information-rich backdrop. An increase in buying volumes may take place after the price settles above the 1.1050 level.
For the next stage of growth in the pound sterling's rate, it is necessary for the price to settle above the 1.3050 level. Otherwise, we can expect the pair to fluctuate within the range of the psychological levels of 1.2950-1.3050.
Candlestick Chart - This consists of rectangles in white and black with lines on the top and bottom. By analyzing each individual candlestick in detail, you can see its characteristics relative to a specific time period: opening price, closing price, highest price, and lowest price.
Horizontal Levels - These are price coordinates at which a price stop or reversal may occur. In the market, these levels are called support and resistance.
Circles and Rectangles - These are highlighted examples where the price has historically reversed. This color highlighting indicates horizontal lines that may exert pressure on the quote in the future.
Up/Down Arrows - These indicate possible future price directions.


