Vea también

 04.04.2024 01:12 PM
Preliminary data on inflation in the eurozone was published on Wednesday. The annual CPI showed a slowdown from 2.6% in February to 2.4% in March. During the American session, The ADP employment report was published. The US private sector added 184K jobs, while analysts had projected an increase of 125K. In addition, Jerome Powell made a statement that the Federal Reserve has enough time to analyze macroeconomic data before deciding on a possible rate cut. All these factors pointed to the inevitable strengthening of the dollar. However, unexpectedly traders began opening short positions on the US dollar. This sell-off is difficult to explain, but we can assume that there was a large-scale flow of capital from the US dollar to the euro. Such actions could only be carried out by a limited number of investment funds and banks.
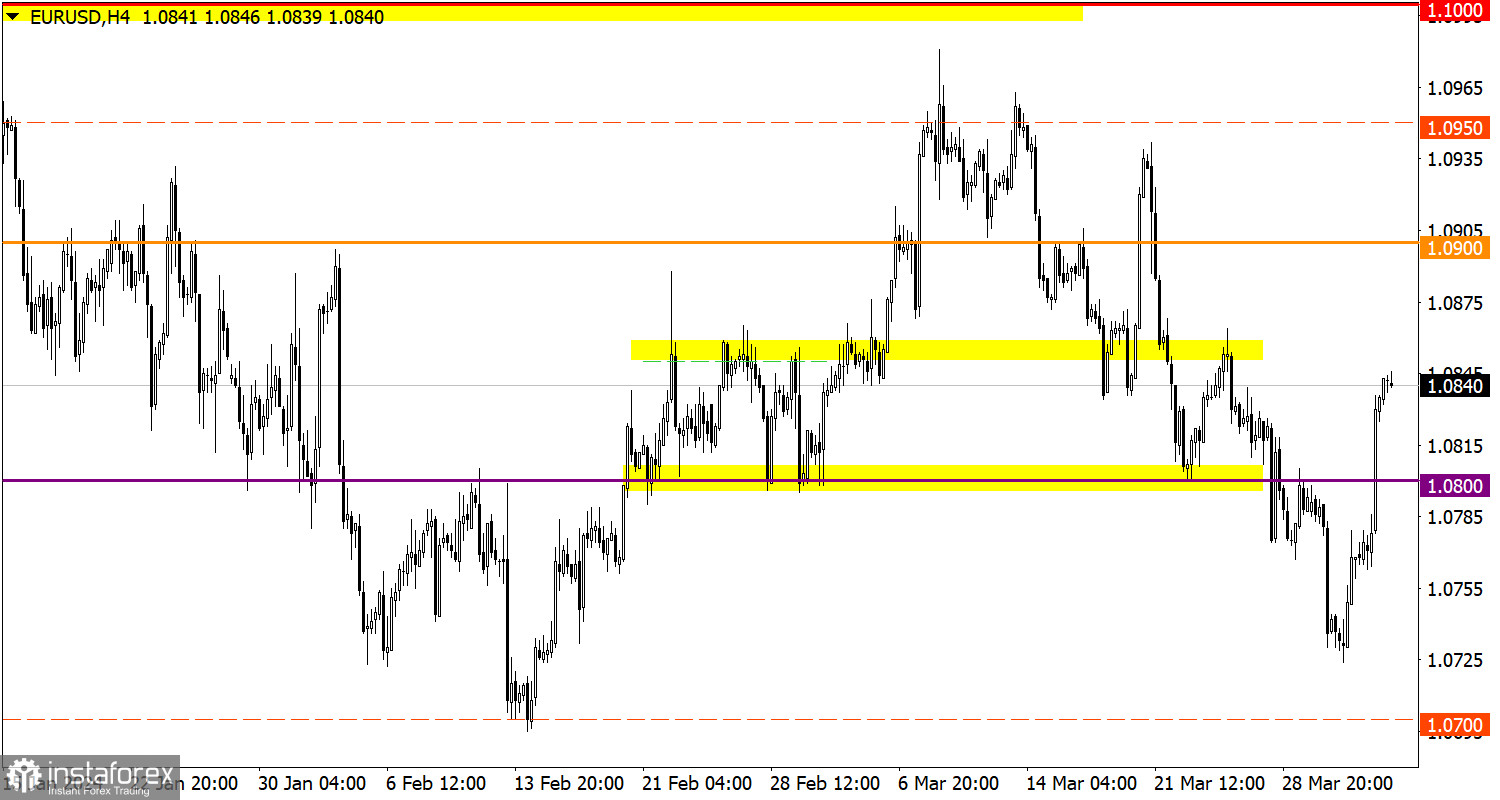
The EUR/USD pair suddenly climbed above the level of 1.0840 as a result of inertial speculative movement, which contradicts the logic of fundamental analysis. From a technical point of view, it is possible that long positions were strengthened at the time of the breakout of 1.0800 from the bottom up.
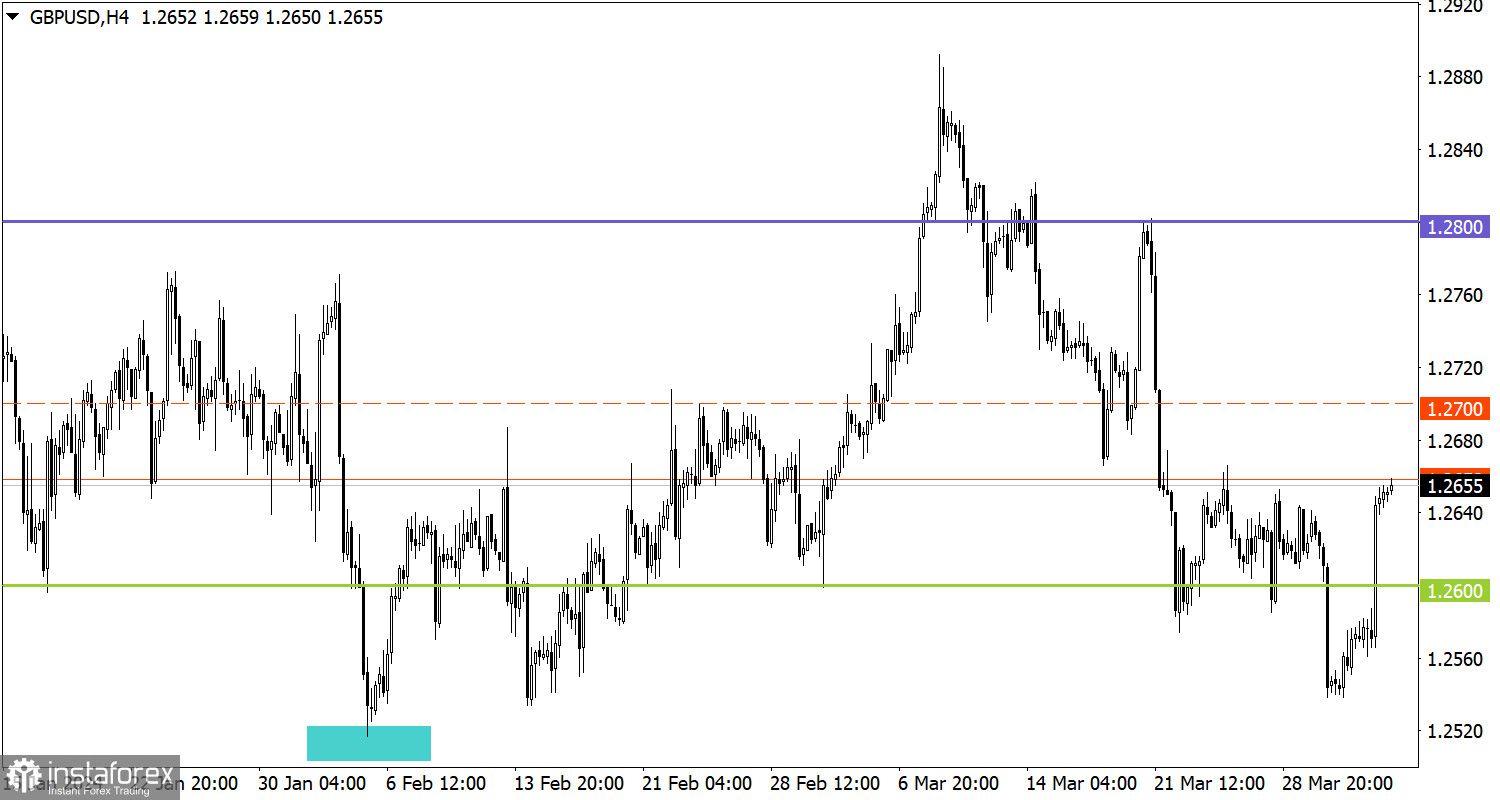
A similar situation is observed in the GBP/USD pair. The upward inertial cycle led to a breakout of the 1.2600 level, reinforcing long positions. This caused a sharp burst in speculative activity, causing the price to rise above 1.2650.

Today, data on producer prices in the EU is due to be published. The rate of decline in factory inflation is expected to slow from -8.6% to -8.3%. If the inflationary process begins to stabilize, this may convince the market that the European Central Bank will be the first to start cutting interest rates. Based on fundamental analysis, these statistics indicate prospects for the weakness in the European currency.
In the current situation, the euro is clearly overbought, which could lead to a slowdown in the ascending cycle with the possible formation of a pullback. However, if inertia continues, overbought signs may be ignored by speculators. In this case, the inertial movement may continue in the direction of the 1.0900 level.
Even though the market is overbought, an inertial movement is still going on, in which technical analysis may not work. In this case, the expected pullback to the level of 1.2600 may give way to a new bullish sequence.
The candlestick chart type consists of graphic rectangles in white and black with lines at the top and bottom. With a detailed analysis of each individual candle, you can see its characteristics relative to a particular timeframe: opening price, closing price, maximum and minimum price.
Horizontal levels are price coordinates relative to which a price may stop or revered its trajectory. In the market, these levels are called support and resistance.
Circles and rectangles are highlighted examples where the price developed. This color highlighting indicates horizontal lines that may put pressure on the price in the future.
Up/down arrows are guidelines for a possible future trajectory.


