Vea también
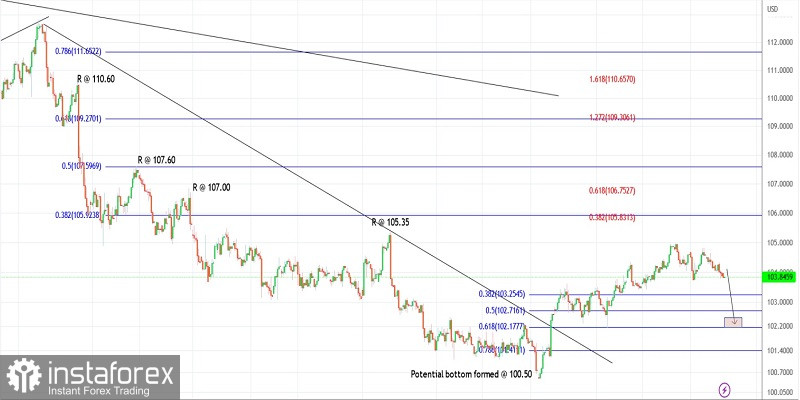
The US dollar index slipped below 104.00 in the early Asia session on Tuesday. After carving an intraday low of 103.78, the index is seen to be trading above 103.85 at this point in writing. Bears are looking inclined to drag lower toward 103.20-25 in the near term before finding some bids coming.
The US dollar index has carved a meaningful larger degree bearish boundary between 114.70 and 100.50 in the past several weeks. Since then, the index has been retracing higher and is projected toward 106.50 at least. In fact, the 0.618 Fibonacci retracement of the above bearish boundary is seen passing through 109.30, which could be the second target.
The US dollar index has carved its first wave of the above corrective rally between 100.50 and 105.00. It is currently progressing lower towards 103.25 and up to 102.50 levels as the second wave unfolds. We can expect a rally toward 106.50 and 109.30 levels thereafter. Ideally, prices stay above 100.50 interim support.
Potential near-term drop to 103.25 and 102.50 before the rally resumes.
Good luck!
You have already liked this post today
*El análisis de mercado publicado aquí tiene la finalidad de incrementar su conocimiento, más no darle instrucciones para realizar una operación.
El par de divisas GBP/USD durante el martes continuó la caída que había comenzado la semana pasada. Recordemos que la semana pasada la moneda estadounidense tenía suficientes razones para fortalecerse
El par de divisas EUR/USD durante el martes volvió a negociarse a la baja, aunque nuevamente no había ninguna razón para el fortalecimiento de la moneda estadounidense. Ayer se supo
Ayer se formaron varios puntos de entrada al mercado. Veamos el gráfico de 5 minutos y analicemos lo que ocurrió. En mi pronóstico de la mañana presté atención al nivel
EUR/USD plan para la sesión europea el 8 de julio. Informes Commitment of Traders COT (análisis de las operaciones de ayer). El euro no tiene intención de caer por mucho
En mi pronóstico de la mañana presté atención al nivel de 1.1749 y planeé tomar decisiones de entrada al mercado desde ese punto. Veamos el gráfico de 5 minutos
Ayer se formaron varios puntos de entrada al mercado. Veamos el gráfico de 5 minutos y analicemos lo que ocurrió. En mi pronóstico matutino presté atención al nivel de 1.3659
EURUSD: plan para la sesión europea del 04 de julio. Informes Commitment of Traders COT (análisis de las operaciones de ayer). El dólar se fortaleció tras los sólidos datos
Ayer se formaron varios puntos de entrada al mercado. Veamos el gráfico de 5 minutos y analicemos lo que ocurrió allí. En mi pronóstico matutino, presté atención al nivel 1.3713
EUR/USD: plan para la sesión europea del 03 de julio. Informes Commitment of Traders COT (análisis de las operaciones de ayer). El dólar volvió a caer tras el informe
Ayer se formaron varios puntos de entrada al mercado. Veamos el gráfico de 5 minutos y analicemos lo que ocurrió. En mi pronóstico matutino, presté atención al nivel 1.3766
cuentas PAMM
InstaForex
Your IP address shows that you are currently located in the USA. If you are a resident of the United States, you are prohibited from using the services of InstaFintech Group including online trading, online transfers, deposit/withdrawal of funds, etc.
If you think you are seeing this message by mistake and your location is not the US, kindly proceed to the website. Otherwise, you must leave the website in order to comply with government restrictions.
Why does your IP address show your location as the USA?
Please confirm whether you are a US resident or not by clicking the relevant button below. If you choose the wrong option, being a US resident, you will not be able to open an account with InstaTrade anyway.
We are sorry for any inconvenience caused by this message.