Vea también
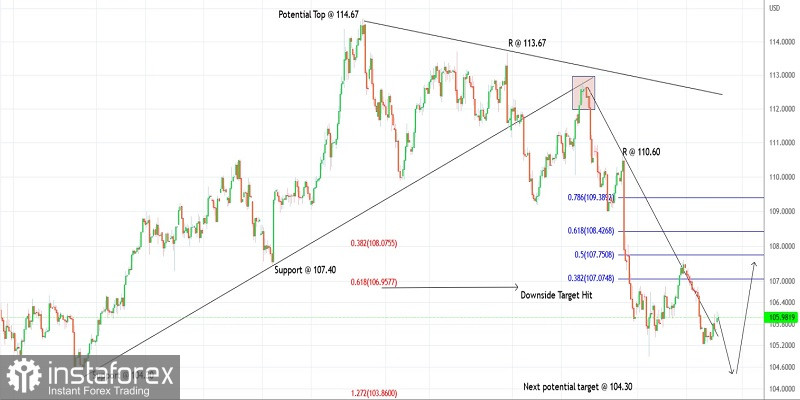
The US dollar index rose through the 106.15 high during the early Asian session on Monday before hitting resistance. The index has eased off a bit and is seen to be trading around 106.00 at this point in writing. The bears might be inclined to be back in control and drag prices lower towards 104.30 which is the next-in-line support.
The US dollar index might be one more low away before turning bullish again above the 114.67 mark. The larger-degree corrective drop, which began from 114.67 earlier, either looks complete at 104.90 or it could print another low around 104.30 as highlighted here on the 4H chart. Either way, it is just a matter of time before the bulls are back in control.
The US dollar index is facing resistance at 107.65, followed by 110.65 and higher; while support is seen around 114.30 levels. The bears might be looking to break below 104.30 and complete the corrective pattern before giving in to the bulls. On the flip side, a break above 107.65 would confirm and accelerate the climb towards 110.65 at least, in the near term.
Potential drop to 104.30 against 107.65, then higher.
Good luck!
You have already liked this post today
*El análisis de mercado publicado aquí tiene la finalidad de incrementar su conocimiento, más no darle instrucciones para realizar una operación.
Ayer se formaron varios puntos de entrada al mercado. Veamos el gráfico de 5 minutos y analicemos lo que ocurrió. En mi pronóstico matutino presté atención al nivel de 1.3659
EURUSD: plan para la sesión europea del 04 de julio. Informes Commitment of Traders COT (análisis de las operaciones de ayer). El dólar se fortaleció tras los sólidos datos
Ayer se formaron varios puntos de entrada al mercado. Veamos el gráfico de 5 minutos y analicemos lo que ocurrió allí. En mi pronóstico matutino, presté atención al nivel 1.3713
EUR/USD: plan para la sesión europea del 03 de julio. Informes Commitment of Traders COT (análisis de las operaciones de ayer). El dólar volvió a caer tras el informe
Ayer se formaron varios puntos de entrada al mercado. Veamos el gráfico de 5 minutos y analicemos lo que ocurrió. En mi pronóstico matutino, presté atención al nivel 1.3766
Ayer se formaron varios puntos de entrada al mercado. Veamos el gráfico de 5 minutos y analicemos lo que ocurrió. En mi pronóstico matutino, presté atención al nivel 1.1806
Ayer se formaron varios puntos de entrada al mercado. Veamos el gráfico de 5 minutos y analicemos lo que ocurrió. En mi pronóstico matutino presté atención al nivel 1.3723
EUR/USD: plan para la sesión europea del 01 de julio. Informes Commitment of Traders COT (análisis de las operaciones de ayer). El euro cerró el mes en un nuevo máximo
El pasado viernes se formaron varios puntos de entrada al mercado. Veamos el gráfico de 5 minutos y analicemos lo que ocurrió. En mi pronóstico matutino, llamé la atención sobre
Club InstaForex
Your IP address shows that you are currently located in the USA. If you are a resident of the United States, you are prohibited from using the services of InstaFintech Group including online trading, online transfers, deposit/withdrawal of funds, etc.
If you think you are seeing this message by mistake and your location is not the US, kindly proceed to the website. Otherwise, you must leave the website in order to comply with government restrictions.
Why does your IP address show your location as the USA?
Please confirm whether you are a US resident or not by clicking the relevant button below. If you choose the wrong option, being a US resident, you will not be able to open an account with InstaTrade anyway.
We are sorry for any inconvenience caused by this message.