Bullish Rectangle
was formed on 16.05 at 21:15:39 (UTC+0)
signal strength 1 of 5
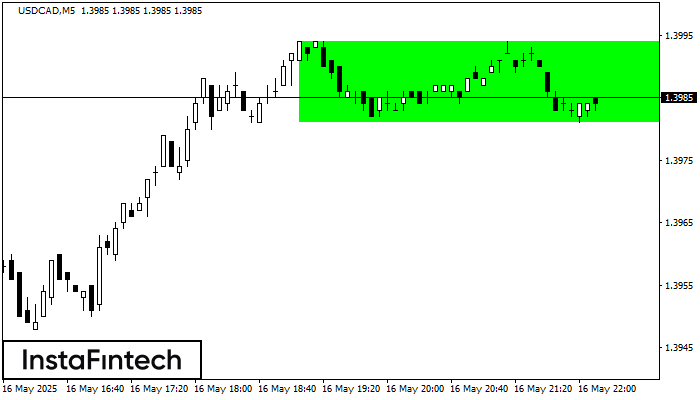
According to the chart of M5, USDCAD formed the Bullish Rectangle. The pattern indicates a trend continuation. The upper border is 1.3994, the lower border is 1.3981. The signal means that a long position should be opened above the upper border 1.3994 of the Bullish Rectangle.
The M5 and M15 time frames may have more false entry points.
- All
- All
- Bearish Rectangle
- Bearish Symmetrical Triangle
- Bullish Rectangle
- Double Top
- Double Top
- Triple Bottom
- Triple Bottom
- Triple Top
- Triple Top
- All
- All
- Buy
- Sale
- All
- 1
- 2
- 3
- 4
- 5
Triângulo Simétrico de Baixa
was formed on 26.06 at 00:14:18 (UTC+0)
signal strength 4 of 5
De acordo com o gráfico de H1, EURNZD fomrou o padrão de Triângulo Simétrico de Baixa. Este padrão sinaliza uma nova tendência de baixa se o limite inferior 1.9215
Open chart in a new window
Triângulo Simétrico de Baixa
was formed on 25.06 at 23:38:14 (UTC+0)
signal strength 3 of 5
De acordo com o gráfico de M30, EURNZD formou o padrão de Triângulo Simétrico de Baixa. Recomendações de negociação: Uma quebra do limite inferior de 1.9215 pode encorajar a continuação
Open chart in a new window
Topo triplo
was formed on 25.06 at 23:30:45 (UTC+0)
signal strength 3 of 5
O padrão Topo triplo foi formado no gráfico do instrumento de negociação NZDUSD M30. É um padrão de reversão com as seguintes características: nível de resistência -5, nível de suporte
Open chart in a new window