Veja também

 18.06.2026 05:46 AM
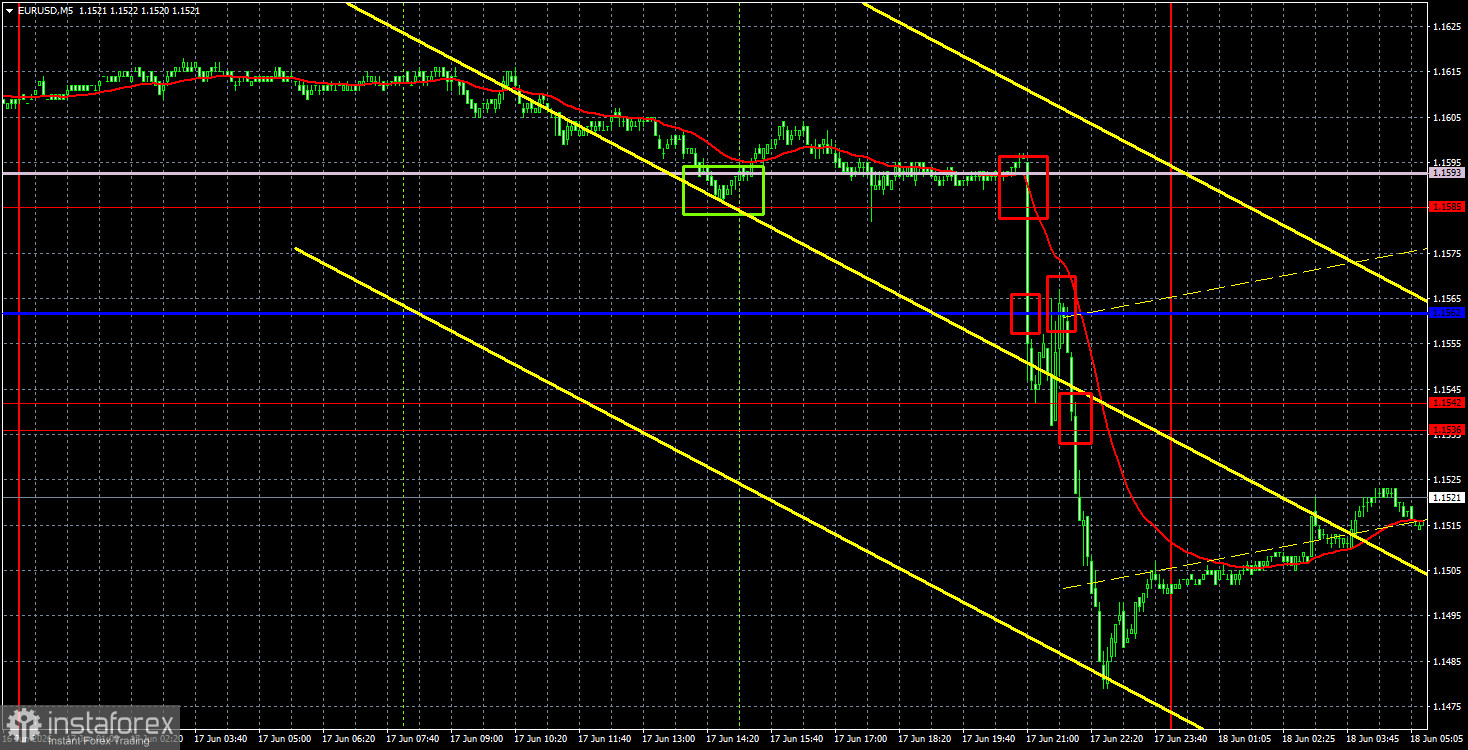
The EUR/USD currency pair traded calmly on Wednesday until the announcement of the FOMC meeting results, after which it declined sharply. The "dot-plot" showed that at least half of the FOMC committee expects at least one rate hike in 2026, with six members believing that the rate should be raised twice in response to high inflation. Thus, the results of the Federal Reserve meeting were unexpected. Few traders anticipated that the U.S. central bank's tone would tighten significantly, which explains the vigorous market reaction. However, in our view, this reaction was excessive, as the conflict in the Middle East may soon come to an end, meaning inflation could begin to slow in the coming months. In addition, the very fact of the deal between Iran and the U.S. works against the U.S. dollar. Therefore, we wouldn't be surprised if the euro regains its position by the end of the week.
From a technical standpoint, yesterday's decline renewed the downward trend. However, FOMC meetings occur every six weeks, and the market continues to ignore most macroeconomic factors. Thus, the decline of the pair yesterday was logical, but whether it will continue remains a big question. Recall that the Fed is only planning to start tightening monetary policy, while the European Central Bank has already begun.
In the 5-minute timeframe, multiple sell signals were generated on Wednesday; however, most occurred after the ECB results announcement. These results suggested a stronger U.S. dollar, allowing traders to open short positions. The movement was strong, and consequently, trades yielded profits.
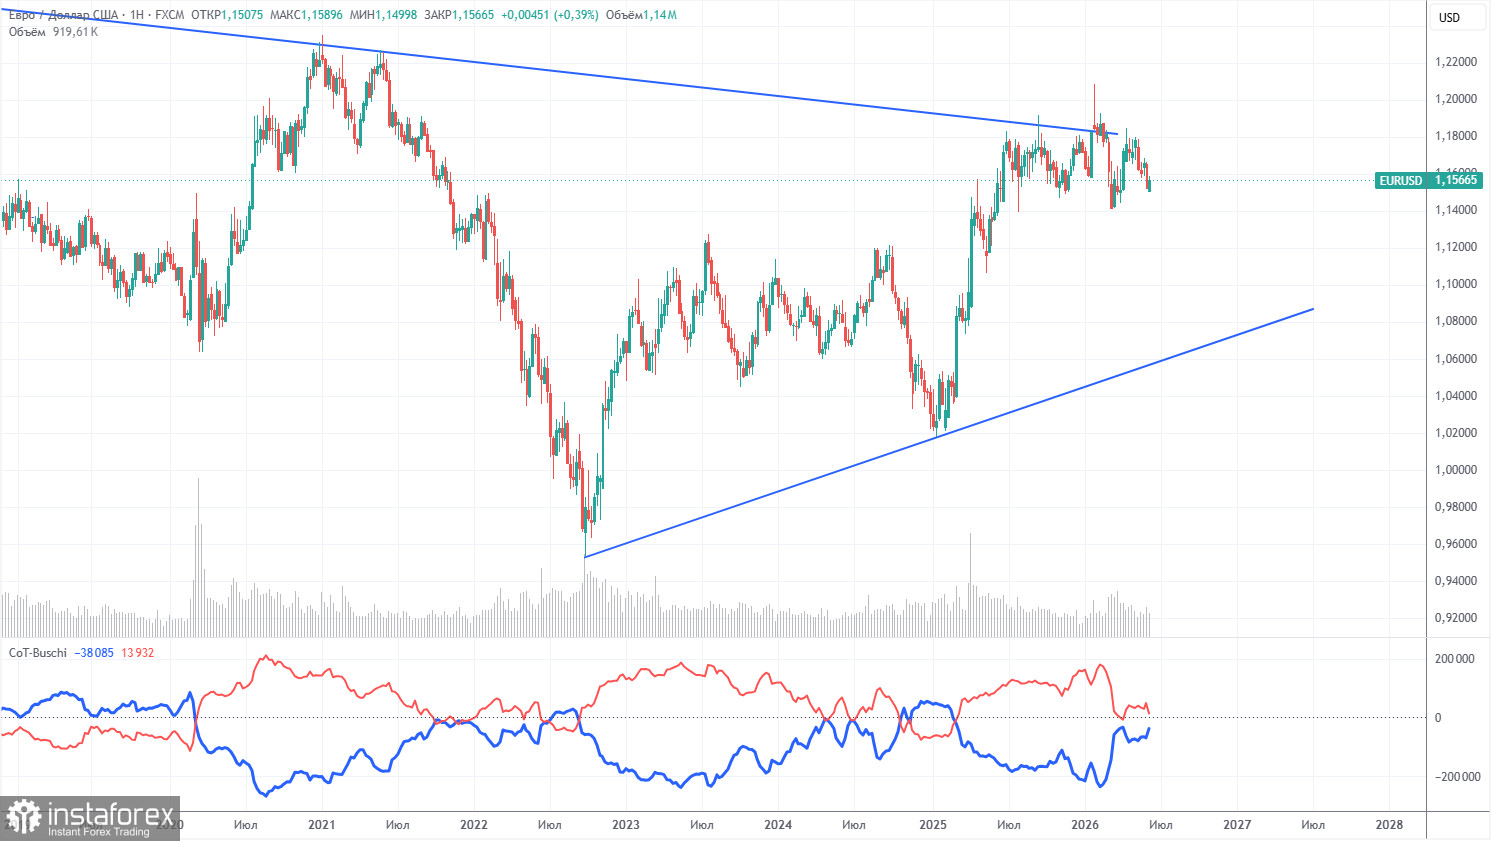
The latest COT report is dated June 9. The illustration of the weekly timeframe clearly shows that the net position of non-commercial traders remains "bullish" but has declined significantly due to geopolitical events. Traders have been offloading the European currency in favor of the U.S. dollar in recent months. Trump's policies have not changed, but the dollar has temporarily acted as a "reserve currency." However, this process may have already come to an end.
We still do not see any fundamental factors supporting the strengthening of the European currency, whereas there are plenty of factors supporting a decline in the U.S. dollar. The war in the Middle East made the dollar super attractive for a time, but once this factor reaches its "expiration date," everything will return to normal, and it may have already expired. In the long term, the euro could fall to as low as $1.08 (the trend line), but the upward trend will still remain relevant. Over the last few months, the pair has not come too close to this line.
The positioning of the red and blue lines in the indicator indicates parity between bulls and bears. During the last reporting week, the longs for the "Non-commercial" group decreased by 15,900, while shorts increased by 19,000. Consequently, the net position fell by 34,900 contracts over the week.
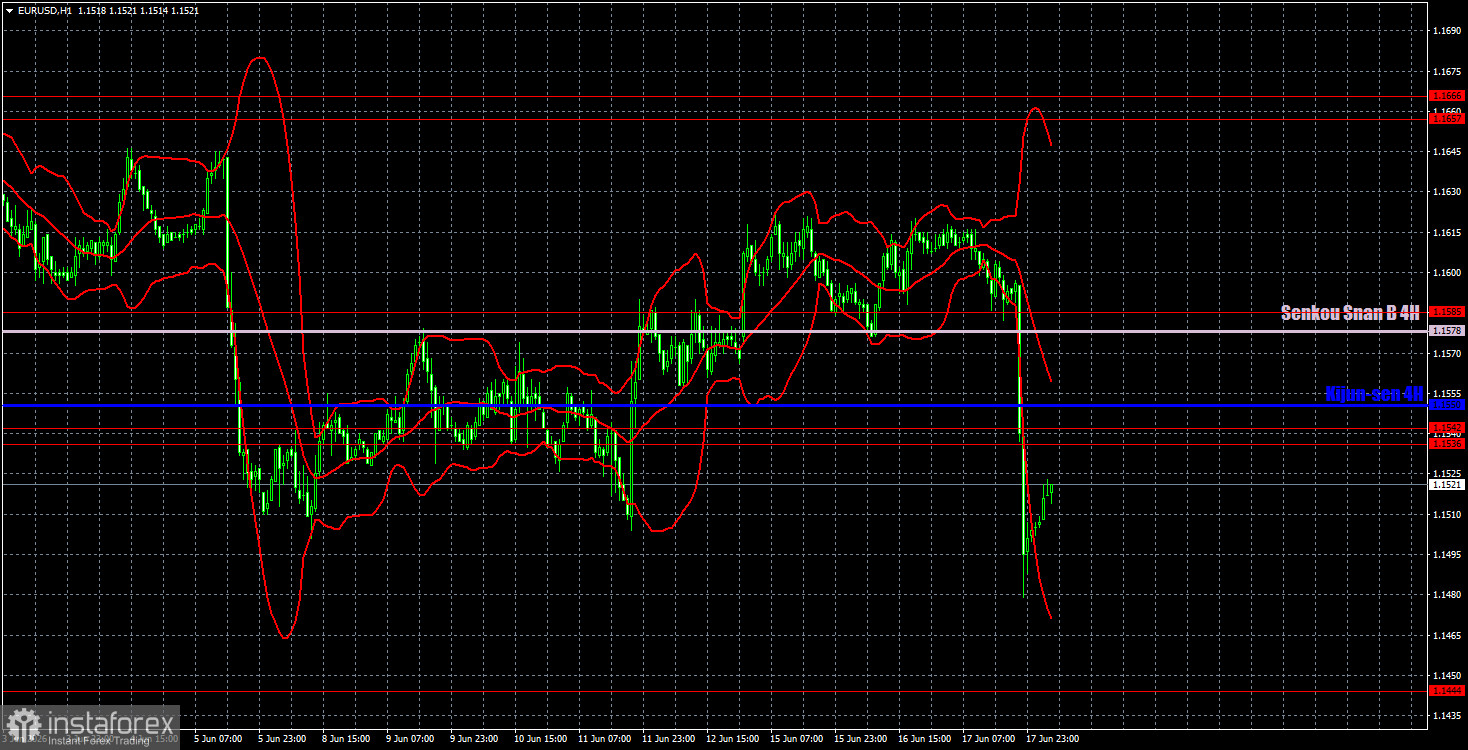
On the hourly timeframe, the upward trend has been canceled, and the continuation of the downward movement is in question. The situation in the Middle East remains tense, but a full-scale war has not yet resumed. The Fed has provided strong support to the U.S. dollar, but this may not be enough for a new downward trend. We still do not believe the dollar will exhibit a strong, sustained trend.
For June 18, we highlight the following trading levels — 1.1362, 1.1426, 1.1536-1.1542, 1.1585, 1.1657-1.1666, 1.1750-1.1760, 1.1786, 1.1830-1.1837, 1.1907-1.1922, as well as the Senkou Span B line (1.1578) and the Kijun-sen line (1.1550). The lines of the Ichimoku indicator may shift throughout the day, which should be taken into account when determining trading signals. Remember to set up a stop-loss order at breakeven if the price moves in the correct direction by 15 pips. This will protect against potential losses if the signal proves false.
On Thursday, there are no significant events or reports scheduled in the EU and the U.S. However, the market may still move quite actively, as traders might continue to react to the results of the FOMC meeting, and the outcomes of the Bank of England meeting could also impact the European currency.
Today, traders may open short positions targeting 1.1444 if the price bounces from the 1.1536-1.1542 area. Long positions can be opened with targets of 1.1578-1.1585 if the pair overcomes the 1.1536-1.1542 area.


