Veja também

 29.04.2026 04:00 AM
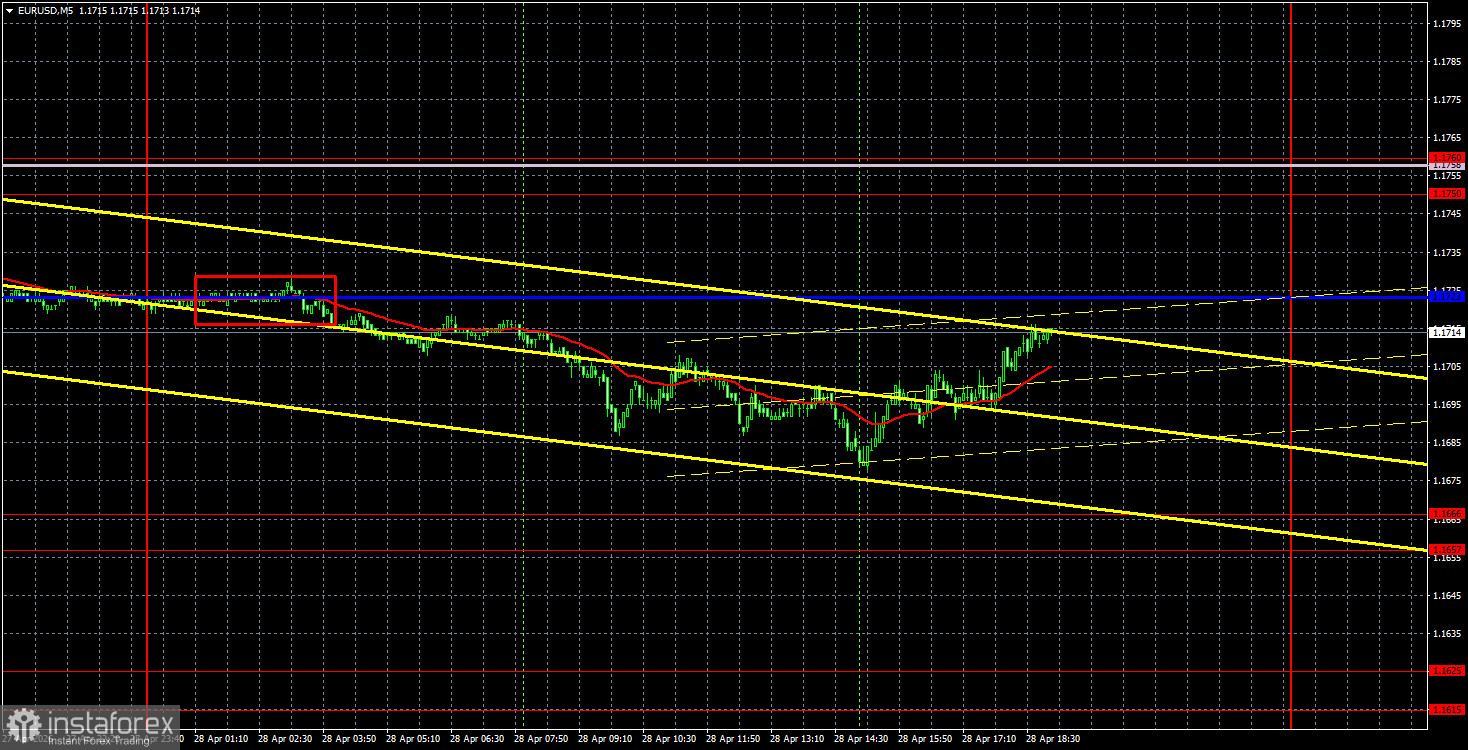
The EUR/USD currency pair continued to exhibit low volatility throughout the day on Tuesday. The fundamental, macroeconomic, and geopolitical backgrounds were again absent, leaving traders with nothing to react to. The technical picture also showed no significant changes. As a result, the market focused on the upcoming FOMC meeting scheduled for Wednesday evening. It cannot be said that the market began to price in the outcomes of the FOMC meeting (which is already known) in advance, as there is essentially nothing to price in. The only event attracting interest is Jerome Powell's speech, which will be his last as Federal Reserve chair at the April meeting. Despite the apparent busyness of the current week, there may not be a single important event in the first three weeks.
From a technical perspective, the upward trend has been broken, but further dollar growth requires a reason. The geopolitical factor no longer provides the same support for the U.S. currency, the macroeconomic background is being ignored by the market, and fundamental events will occur later this week, while the long-term trend remains upward. Therefore, we believe the probability of a new rise in the pair is higher than the probability of a continuation of the decline. However, now, in order to be confident in such a scenario, breaking through the Ichimoku indicator lines is necessary.
On the 5-minute timeframe on Tuesday, only one sell signal was generated. During the Asian trading session, the pair rebounded from the Kijun-sen line and moved down about 30 pips throughout the day, with volatility again being low, and the nearest target area was not reached. By evening, the price returned to the critical line.
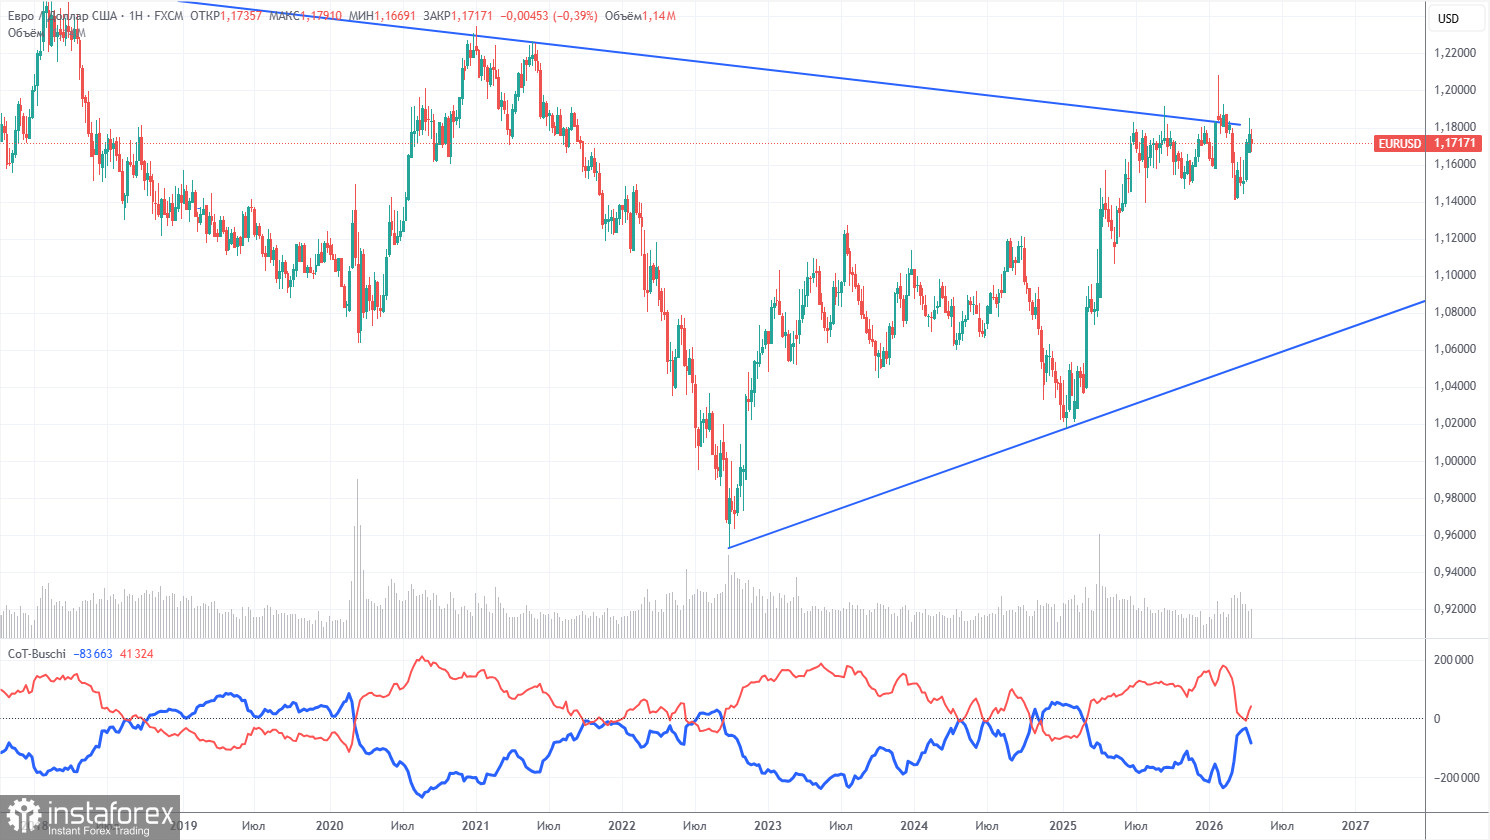
The latest COT report is dated April 21. The weekly timeframe illustration clearly shows that the net position of non-commercial traders remains "bullish," but it rapidly declines amid geopolitical events. Traders have been offloading the euro in favor of the U.S. dollar in recent months. Donald Trump's policy has not changed, but for some time now, the dollar has served as a "reserve currency." However, this process may already be behind us.
We still do not see any fundamental factors that would strengthen the euro; however, sufficient factors remain for the American dollar to weaken. The war in the Middle East made the dollar temporarily super-attractive, but when this factor runs out of "shelf life," everything will revert to the way it was. This could have already expired. In the long term, the euro may fall to the level of $1.06 (the trend line), but the upward trend will still remain relevant. Currently, the pair has not moved significantly away from the descending trend line, which has been broken several times.
The positioning of the red and blue lines of the indicator indicates parity between bulls and bears. Over the last reporting week, the number of long positions in the "Non-commercial" group increased by 2,700, while the number of shorts decreased by 12,500. Accordingly, the net position increased by a total of 15,200 contracts over the week.
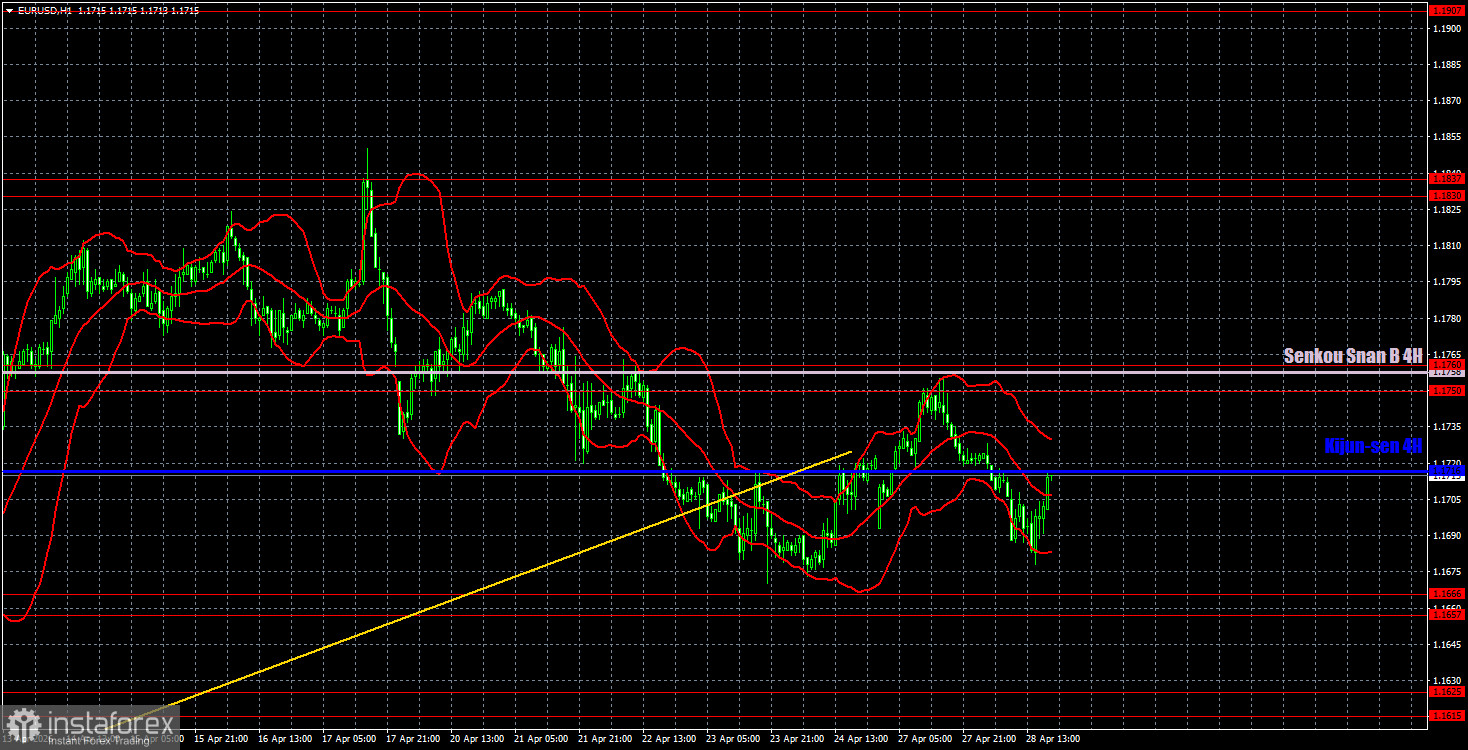
On the hourly timeframe, the EUR/USD pair has started to form a downward trend. The situation in the Middle East remains tense but is not worsening, so there are currently few strong reasons for the U.S. dollar to strengthen further. There will be enough significant events this week, so good volatility can be expected. Technically, the dollar is in a more favorable position than the euro.
For April 29, we highlight the following levels for trading: 1.1362, 1.1426, 1.1542, 1.1615-1.1625, 1.1657-1.1666, 1.1750-1.1760, 1.1830-1.1837, 1.1907-1.1922, as well as the Senkou Span B line (1.1758) and Kijun-sen (1.1716). The Ichimoku indicator lines may shift during the day, which should be taken into account when determining trading signals. Remember to set a stop-loss order to break even if the price moves in the right direction by 15 pips. This will protect against potential losses if the signal turns out to be false.
On Wednesday, Germany will publish a fairly important inflation report for April, the U.S. will have several secondary reports, and in the evening, the FOMC meeting and press conference with Jerome Powell will take place. Thus, the main movements are expected in the evening.
Today, traders can open short positions if the price rebounds from the Kijun-sen line or from the 1.1750-1.1760 area, targeting the 1.1657-1.1666 area. Long positions can be opened upon price consolidation above the 1.1750-1.1760 area, with a target of 1.1830-1.1837.
Price levels of support and resistance – thick red lines, around which the movement may end. They are not sources of trading signals.
Kijun-sen and Senkou Span B lines – lines of the Ichimoku indicator that are carried over to the hourly timeframe from the 4-hour one. They are strong lines.
Extreme levels – thin red lines from which the price has previously bounced. They are sources of trading signals.
Yellow lines – trend lines, trend channels, and any other technical patterns.
Indicator 1 on COT charts – the size of the net position of each category of traders.


