
Veja também


 24.09.2026 06:26 AM
The daily chart for the Nasdaq index (#NDX) shows continued trading within a strong, positive upward trend. The price is currently trading at the 30,365.8 level, holding firm above key pivot points and major resistance levels following a distinct bullish surge.
Technical Analysis and Price Action
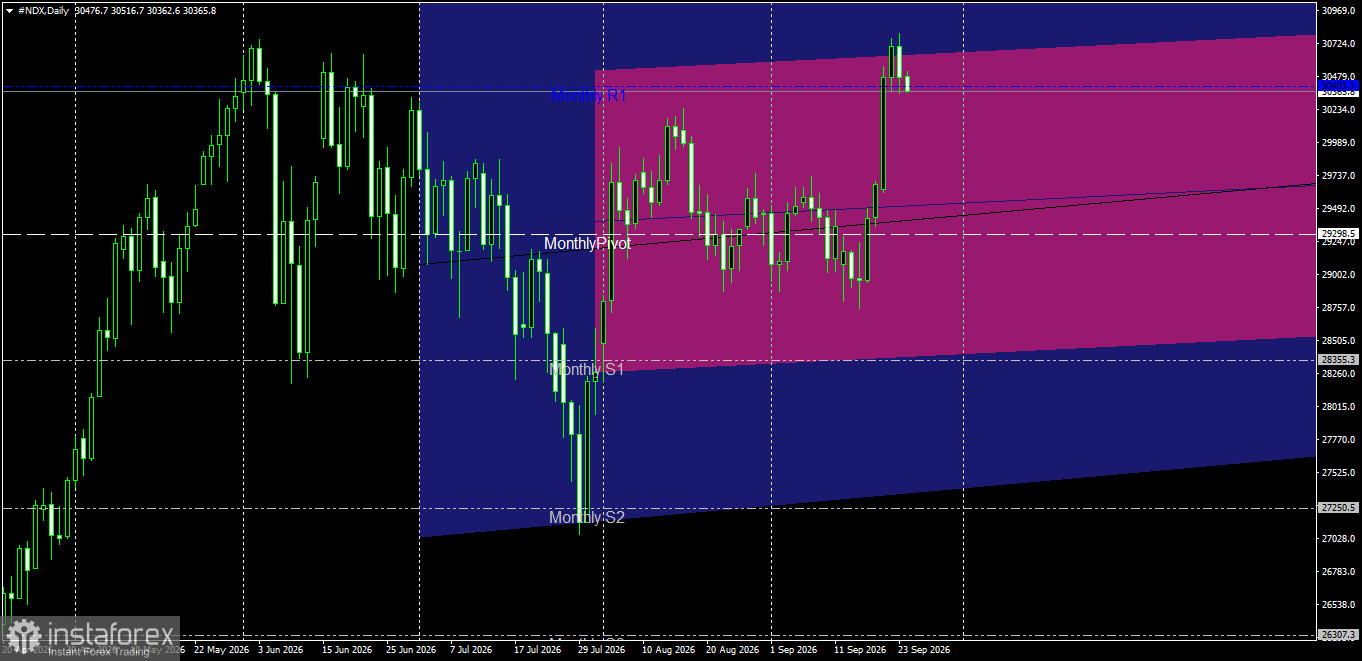
Overlapping Price Channel Structure: The index is moving within a primary ascending channel (blue) and a secondary ascending channel characterized by accelerating momentum (pink/red). After establishing a strong pivot low near the first monthly support level (Monthly S1) at 28,355.3 and the second monthly support level (Monthly S2) at 27,250.5, the price surged upward, crossing the channel's midline.
Breakout of Pivot and Resistance: The price successfully broke through the monthly pivot point at 29,298.5 and subsequently traded firmly above the first monthly resistance level (Monthly R1) at 30,403.8, surpassing the previous peak and reaching levels near 30,724.0.
Key Support and Resistance Levels
Key Resistance Levels:
Resistance 1: The recent price peak at 30,724.0, followed by the high range at 30,969.0.
Resistance 2: The upper boundary of the pink ascending channel, in the 31,200.0 – 31,500.0 range. Key Support Levels:
First Support: 30403.8 (Broken Monthly R1, now acting as support).
Second Support: 29298.5 (Monthly Pivot and key trend support).
Key Support: 28355.3 (Monthly S1 and previous low).
Price Action Outlook and Trading Recommendations
Bullish Scenario (Primary):
The bullish scenario is considered the most likely and appropriate as long as the price maintains trading above the Monthly Pivot level (29298.5) and the broken resistance at 30403.8.
Recommendation: Buy upon a corrective retest near the 30403.8 – 30234.0 – 29900.0 zones.
Technical Targets: Breaking the 30724.0 peak opens the way toward 30969.0 (first target) and an extension to the 31200.0 level (second target).
Stop Loss: A daily candle close below the 29298.5 level.
Bearish Corrective Scenario (Alternative):
This scenario activates if selling pressure emerges, breaking the current uptrend and pushing the price back below the Monthly Pivot.
Validation Condition: Breaking the 29298.5 level and closing below it on a daily basis.
Technical Targets: A return to test the first monthly support at 28355.3. Risk Management
Risk management principles require strict adherence to setting stop-loss targets to protect capital against price volatility in index markets, while ensuring that the risk taken on any single trade does not exceed 1% to 2% of the total trading portfolio.
The H1 chart for the Nasdaq index (#NDX) shows the price stabilizing within a short-term bearish corrective wave; the index is currently trading at the 30,362.0 level following a pullback from the peak recorded near the third weekly resistance level (Weekly R3) at 30,945.3.
Technical Analysis and Price Action
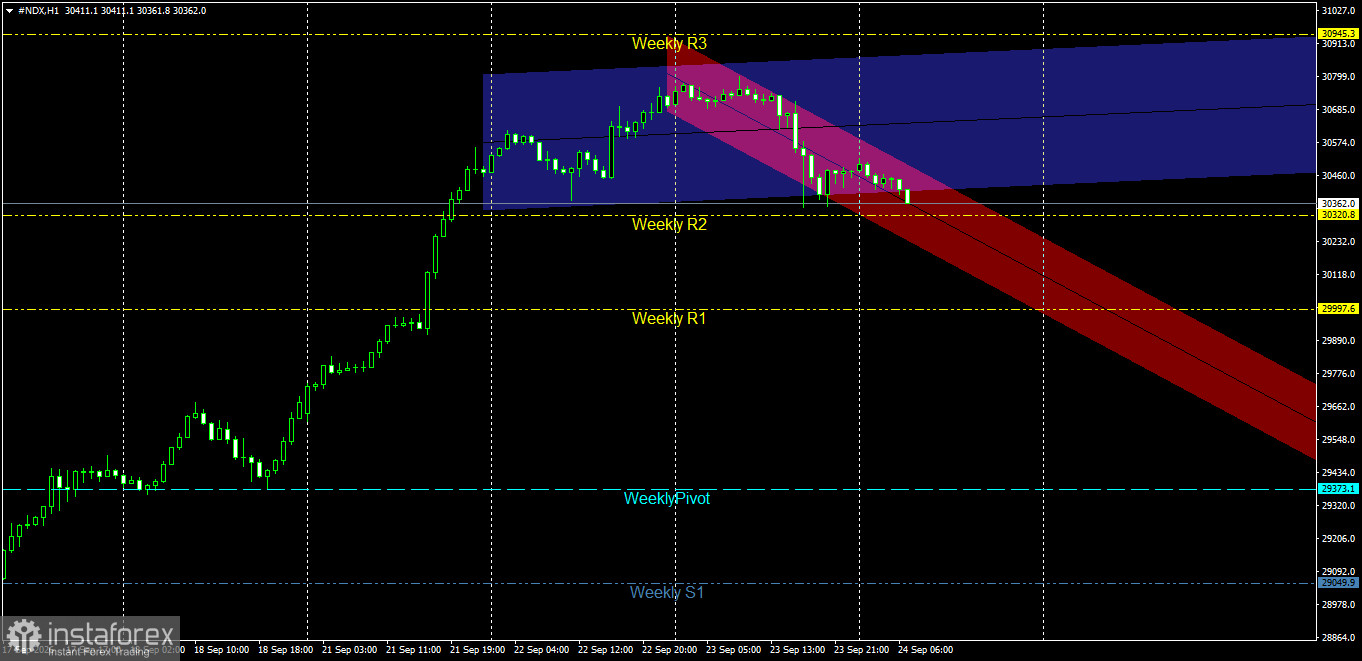
Overlapping Channel Structure: The index moves within a primary ascending channel (blue) representing the overall bullish trend; however, the price has recently entered a minor bearish path defined by an accelerating descending channel (red/pink). This decline reflects significant profit-taking following previous gains.
Interaction with Weekly Pivot and Resistance Levels: After failing to sustain a position above the third weekly resistance level (Weekly R3) at 30,945.3, the price dropped, breaching the lower boundary of the blue channel and momentarily breaking the second weekly resistance level (Weekly R2) at 30,320.8. The price is currently under pressure, attempting to rebound from intraday support levels while fluctuating near the boundaries of the red channel.
Key Support and Resistance Levels
Key Resistance Levels:
Resistance 1: 30,320.8 (the broken Weekly R2, now acting as intraday resistance), followed by 30,460.0.
Resistance 2: 30,945.3 (Weekly R3 and the previous peak).
Key Support Levels:
Support 1: 29,997.6 (Weekly R1 and the near-term correction target). Second Support: 29,373.1 (Weekly Pivot).
Key Support: 29,049.9 (Weekly S1).
Price Action Outlook and Trading Recommendations
Bearish Scenario (Primary):
A continuation of the bearish corrective trend is the most likely outcome as long as the price trades below the main blue channel and within the red bearish channel.
Recommendation: Sell the index upon a retest of the intraday resistance zone between 30,320.8 and 30,460.0, or if the price holds below the 30,400.0 level.
Technical Targets: Target the broken Weekly R1 level at 29,997.6 as the primary target, extending toward the Weekly Pivot at 29,373.1 as the secondary target.
Stop Loss: A one-hour candle close above 30,685.0.
Bullish Corrective Scenario (Alternative):
This scenario is triggered if buyers successfully break above the upper boundary of the red channel and stabilize back inside the main blue channel.
Confirmation Condition: Breaking the 30,460.0 level and holding above 30,574.0 for a full one-hour candle.
Technical Targets: A return to test the weekly high at 30,945.3.
Risk Management
Trading index contracts requires strict adherence to risk management rules and precise placement of stop-loss orders due to rapid volatility; ensure that risk per trade does not exceed 1% to 2% of your capital.


